Preskoči na glavni sadržaj
Prijava
Sign up for FREE
arrow_back
Biblioteka

Unit 6 - Lesson 4 - Grade 3: Illustrative Mathematics

star
star
star
star
star
Posljednje ažuriranje over 1 year ago
13
Napomena autora:

Grade 3 Unit 6

Lesson 4: Interpret Measurement Data on Line Plots

CC BY 2021 Illustrative Mathematics®

Grade 3 Unit 6

Lesson 4: Interpret Measurement Data on Line Plots

CC BY 2021 Illustrative Mathematics®

Lesson: Interpret Measurement Data on Line Plots
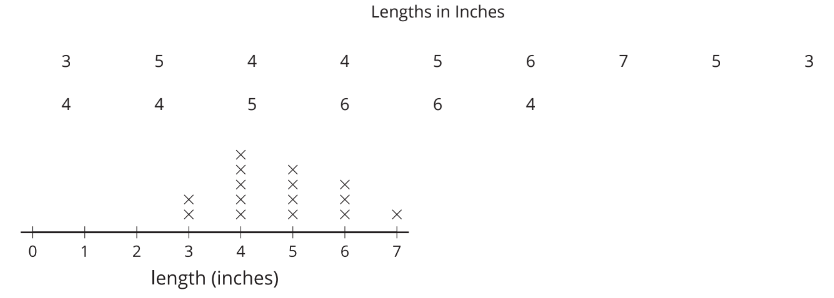
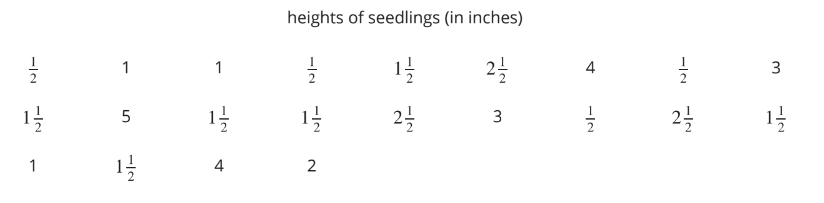
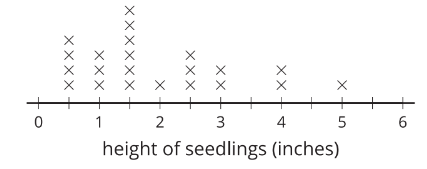
Notice and Wonder: A List and a Line Plot (Warm Up)

1
1

A Set of Seedlings

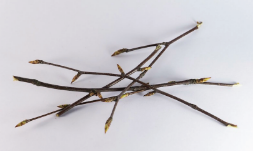
All About Twigs

Cool Down: Interpret and Choose
1
Pitanje 1
1.

What do you notice?

Pitanje 2
2.

What do you wonder?

1
Pitanje 3
3.

Write 3 statements about the measurements represented in the line plot.

1
Pitanje 4
4.

What questions could be answered more easily with the line plot than the list? Write at least 2 questions.

1
Pitanje 5
5.

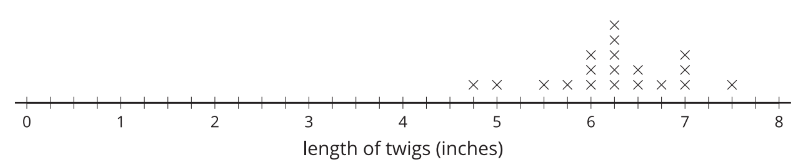
How many twig lengths are represented in the line plot?

1
Pitanje 6
6.

How many of the twigs are the following inches long?

1
1
1
1
1
1
Pitanje 13
13.

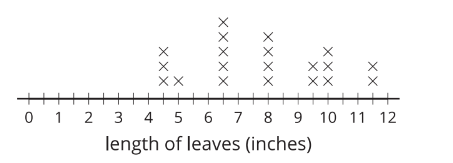
Select all the statements that are true about the measurements in the line plot.

Pitanje 7
7.

How many of the twigs are less than 6 inches long?

Pitanje 8
8.

How many of the twigs are more than 6 inches long?

Pitanje 9
9.

What is the length of the shortest twig?

Pitanje 10
10.

What is the length of the longest twig?

Pitanje 11
11.

What is the most common twig length?

Pitanje 12
12.

Add an “x” to the line plot that would represent a twig with a length between 3 and 4 inches.

What is the length of the twig you added to the line plot?