Which graph goes with this data table?


Which graph goes with this data table?
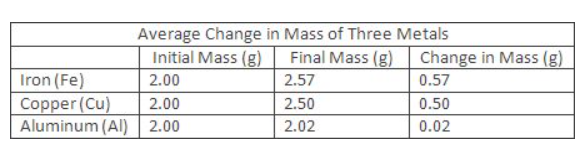
A student is trying to determine which type of metal will change the most after being exposed to water. The student obtains 2 gram samples of aluminum, iron, and copper. The student will run three trials for each type of metal. Each 2 gram sample is placed in separate glass beakers each containing 50mL of water. After the samples have been left in the beakers for two weeks, the student removes each metal from the water, and leaves them to dry on a paper towel for three days. After drying, the student takes the mass of each metal using an electronic balance. The new mass is recorded in a data table.