Ɛhia
1
8.11.A
8.5.C
Ɛhia
1
8.11.A
8.5.C
Ɛhia
1
8.11.A
8.5.C
Ɛhia
1
8.11.A
8.5.C
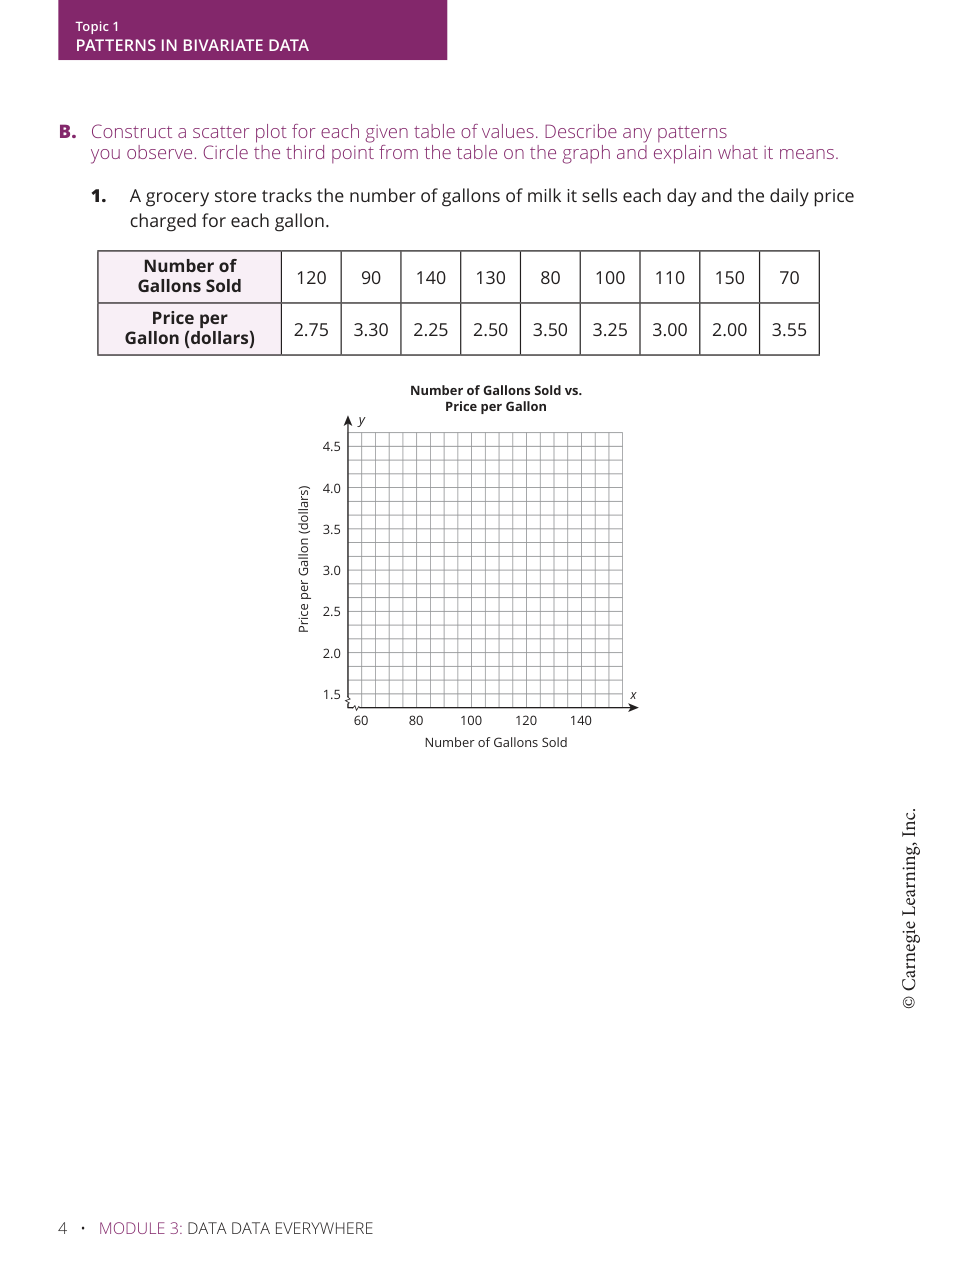
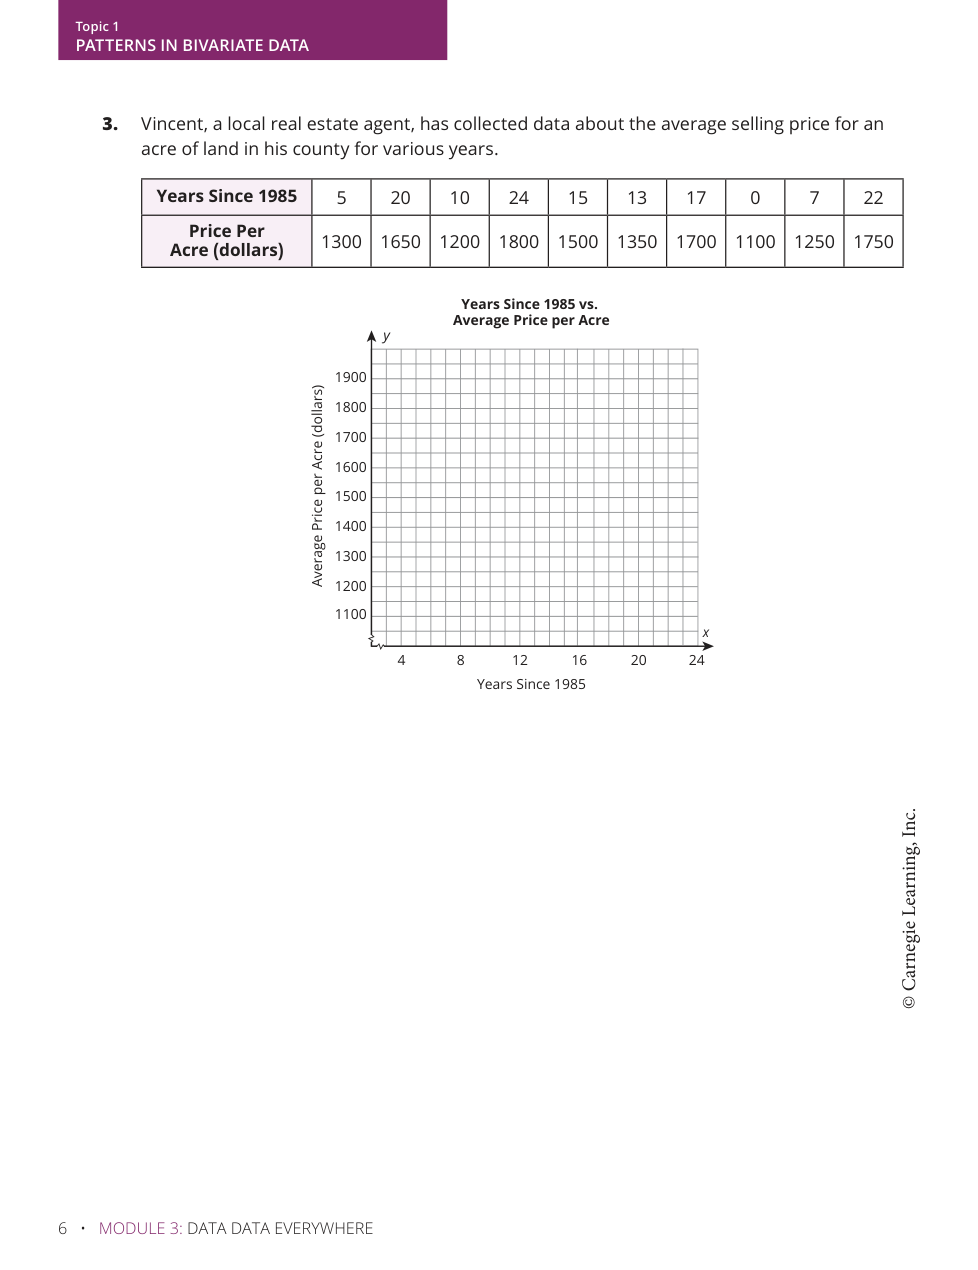
Circle the third point from the table on the graph (in the question above) and explain what it means.

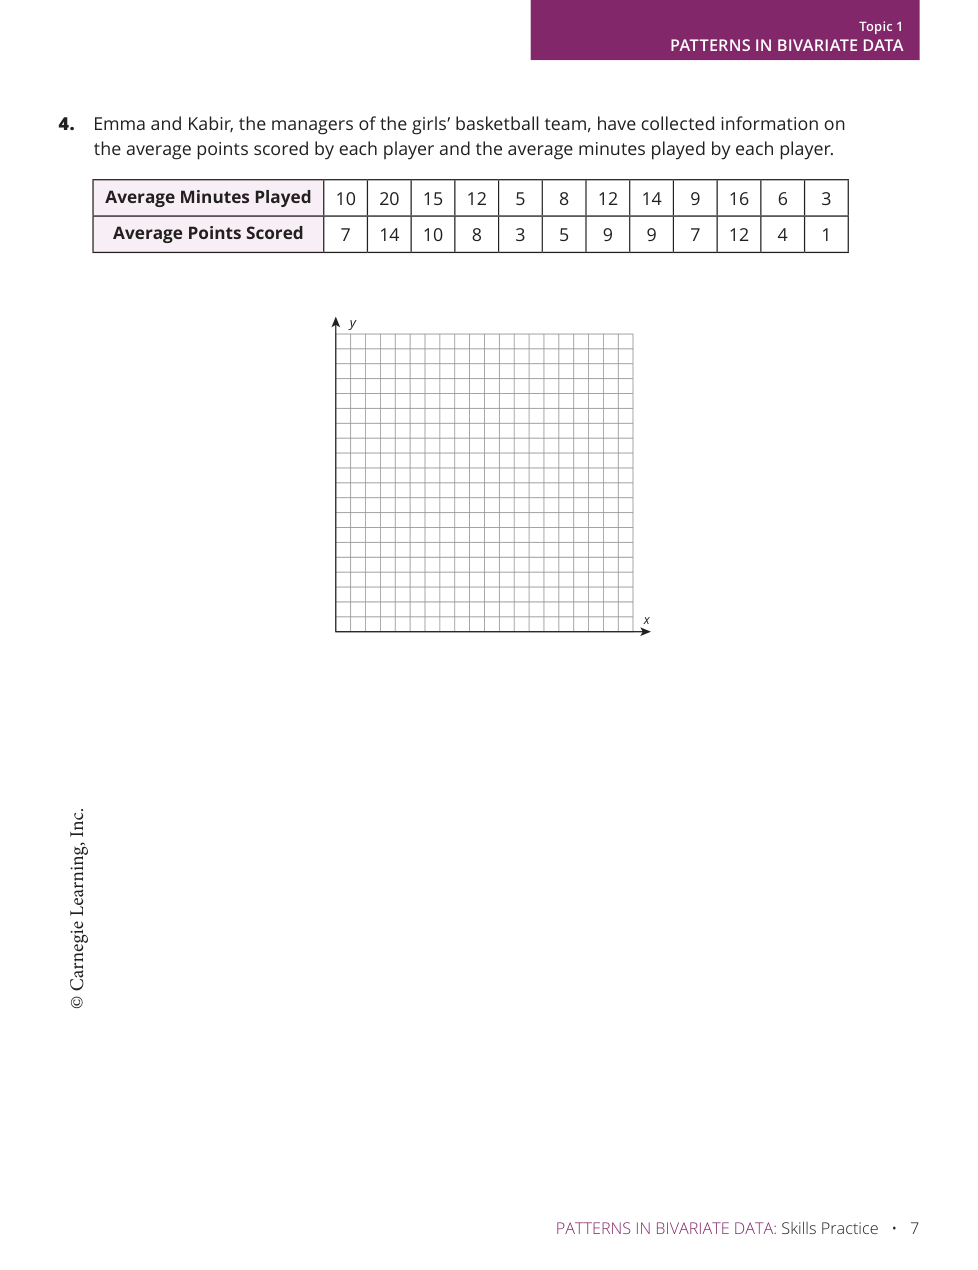
Circle the third point from the table on the graph (in the question above) and explain what it means.
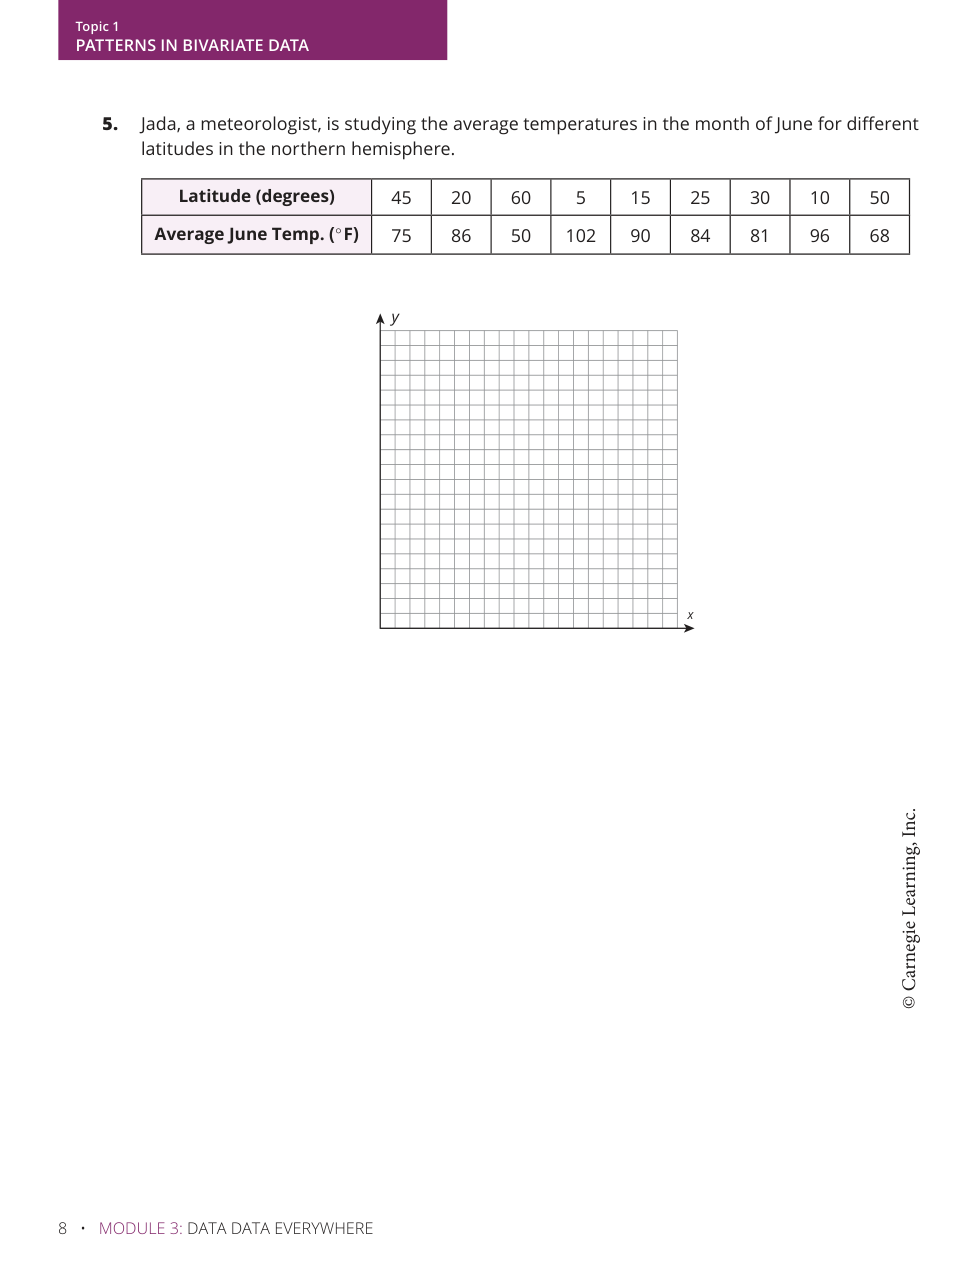
Circle the third point from the table on the graph (in the question above) and explain what it means.
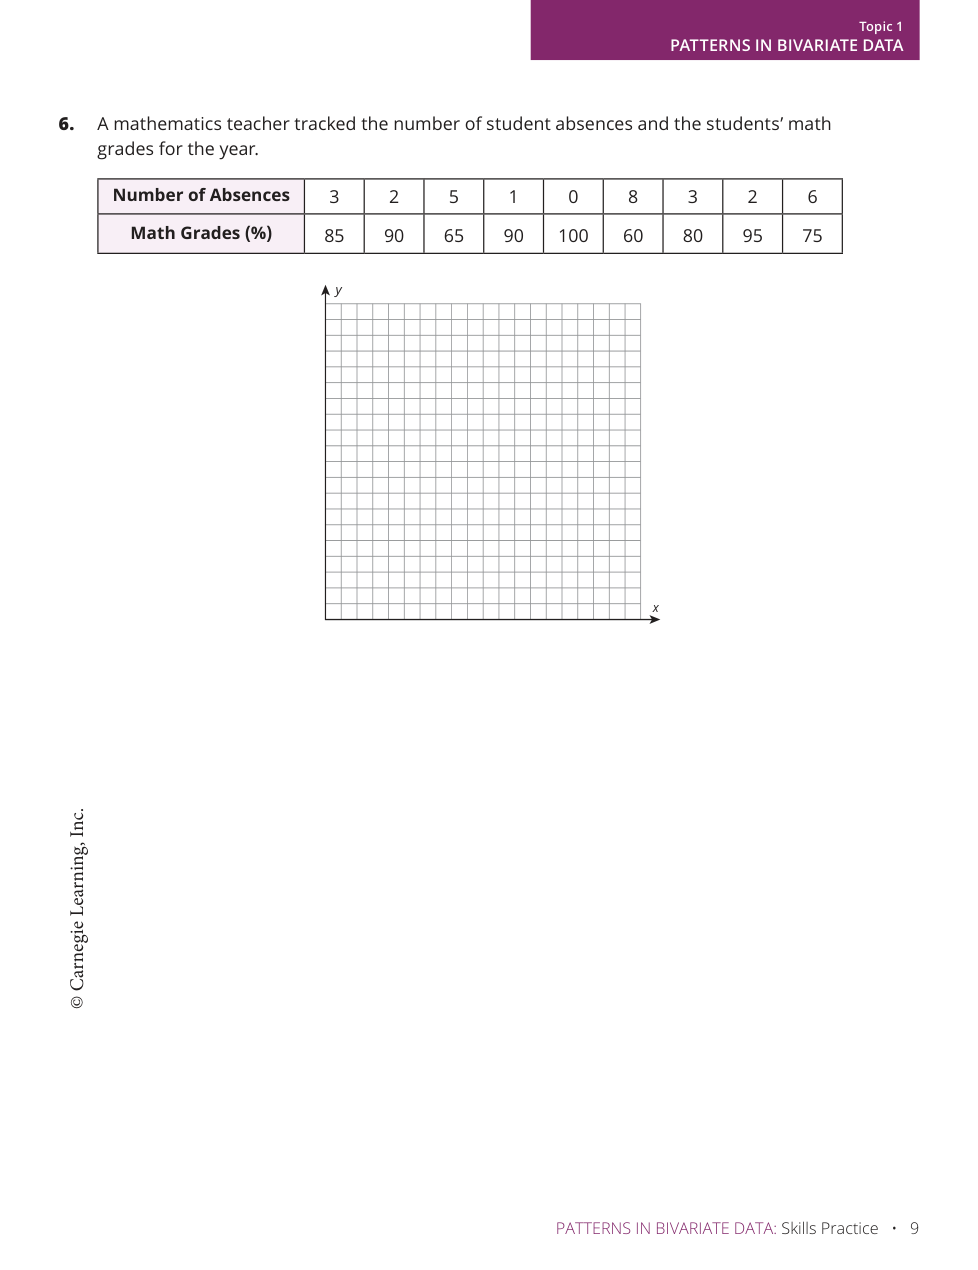
Circle the third point from the table on the graph (in the question above) and explain what it means.
Circle the third point from the table on the graph (in the question above) and explain what it means.
Circle the third point from the table on the graph (in the question above) and explain what it means.
Explanatory Variable
Response Variable
Association
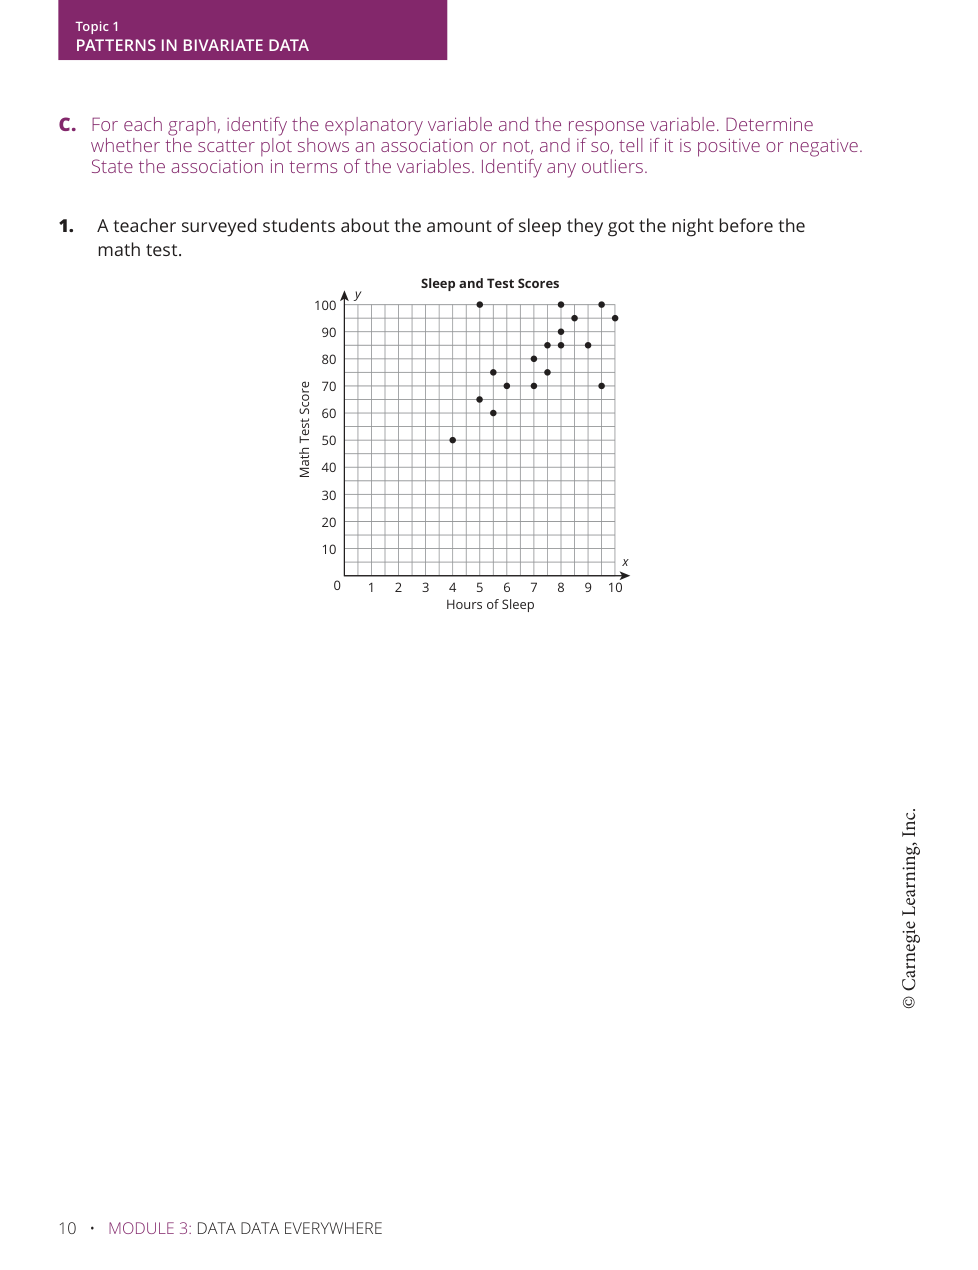
The points (5, 100) and (9.5, 70) are
potential outliers.