Carrying Capacity
star
star
star
star
star
Posljednje ažuriranje almost 2 years ago
13
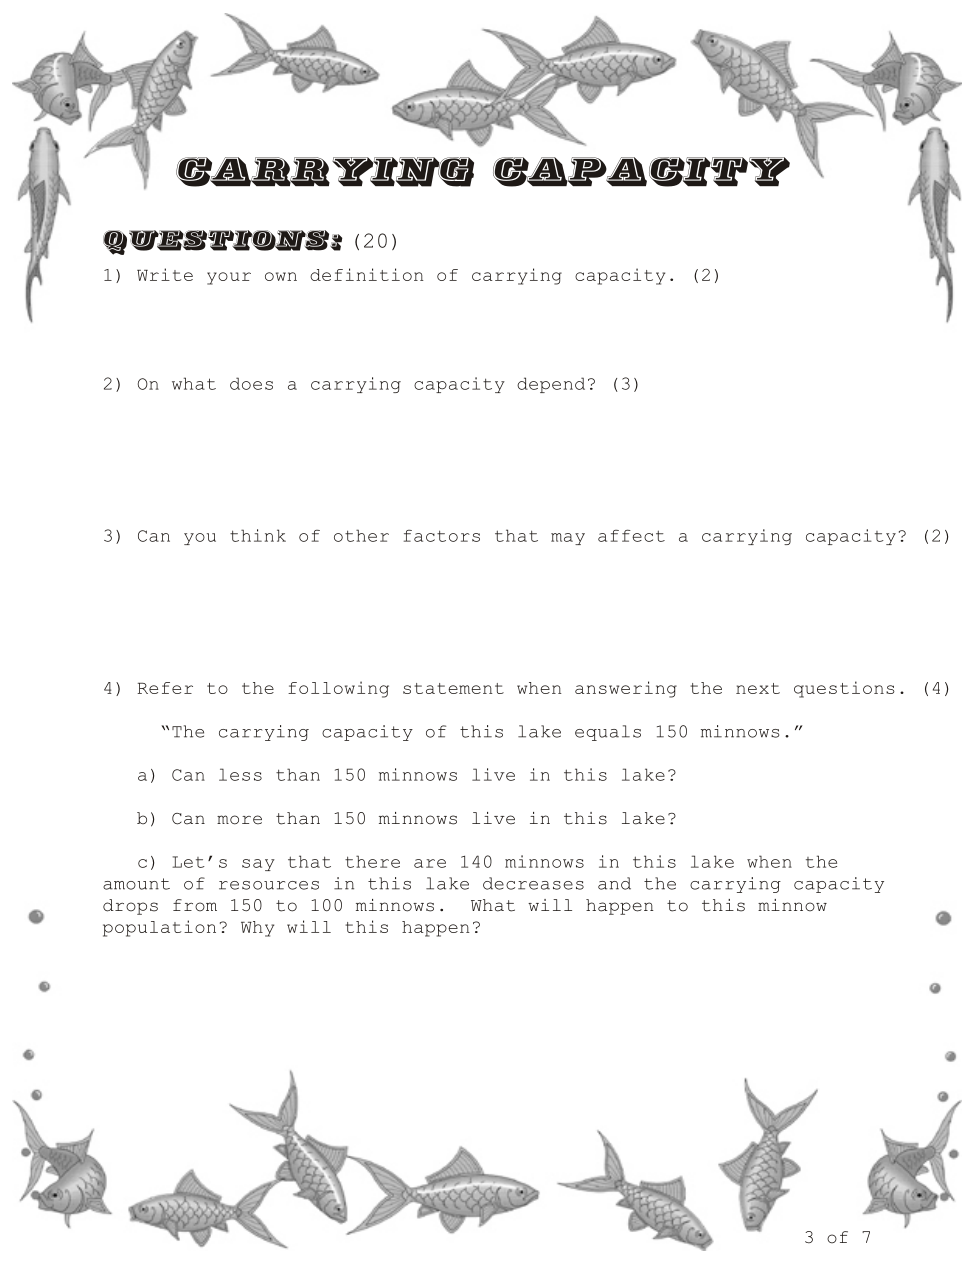
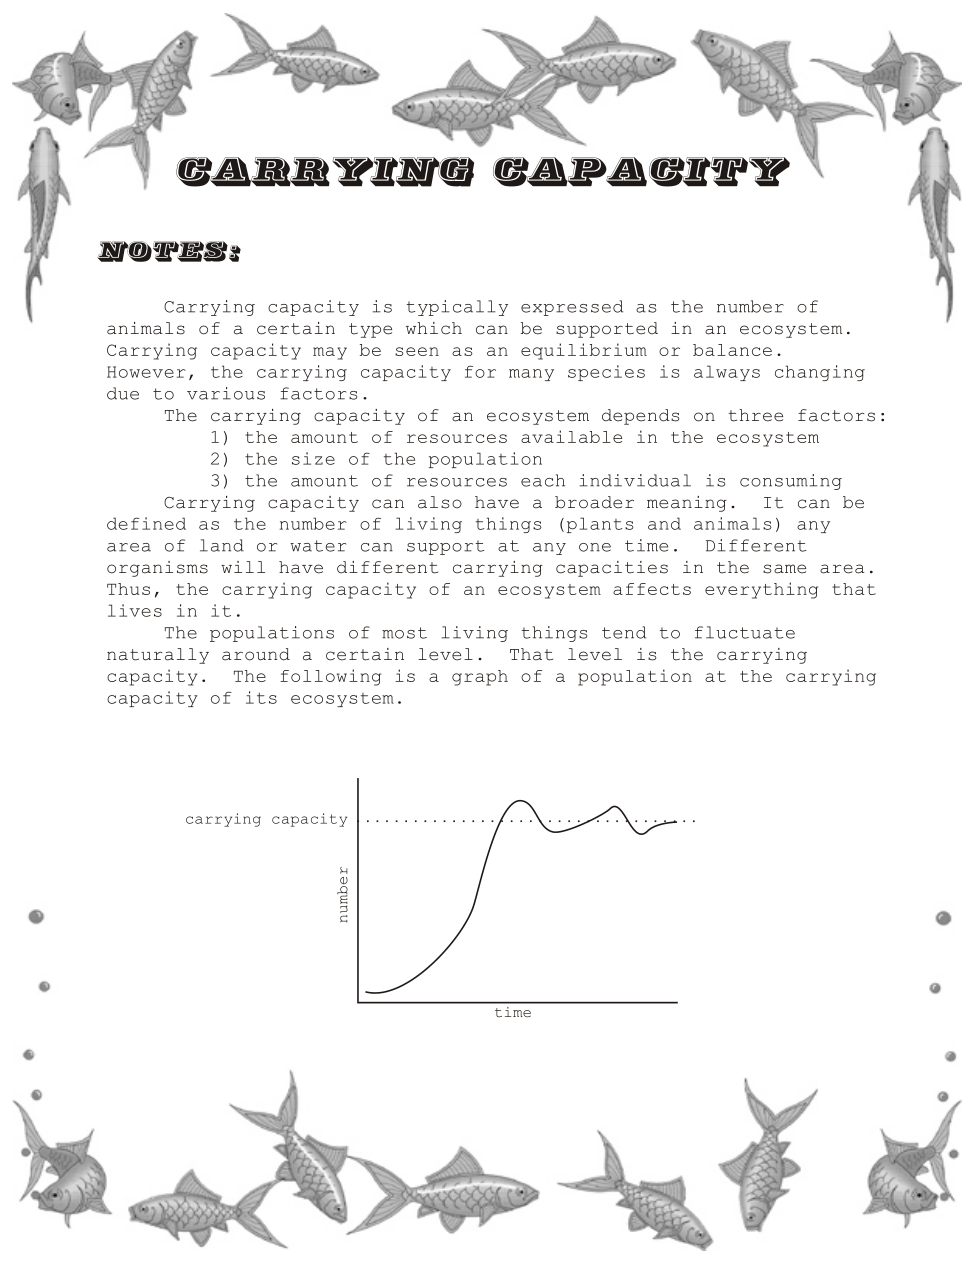
1. IN YOUR OWN WORDS, what is carrying capacity?
2. What are the 3 factors carrying capacity depends on?
3. Besides what you put for #2, what are other factors that may affect a carrying capacity?
4a. If the carrying capacity of a lake is 150 minnows (fish), can less than 150 minnows live in this lake?
4b. If the carrying capacity of a lake is 150 minnows (fish), can more than 150 minnows live in this lake?
4c. Let's say that there are 140 minnows in this lake when the amount of resources in this lake decreases and the carrying capacity drops from 150 to 100 minnows.
What will happen to this minnow population? Why will this happen? (Select 2)
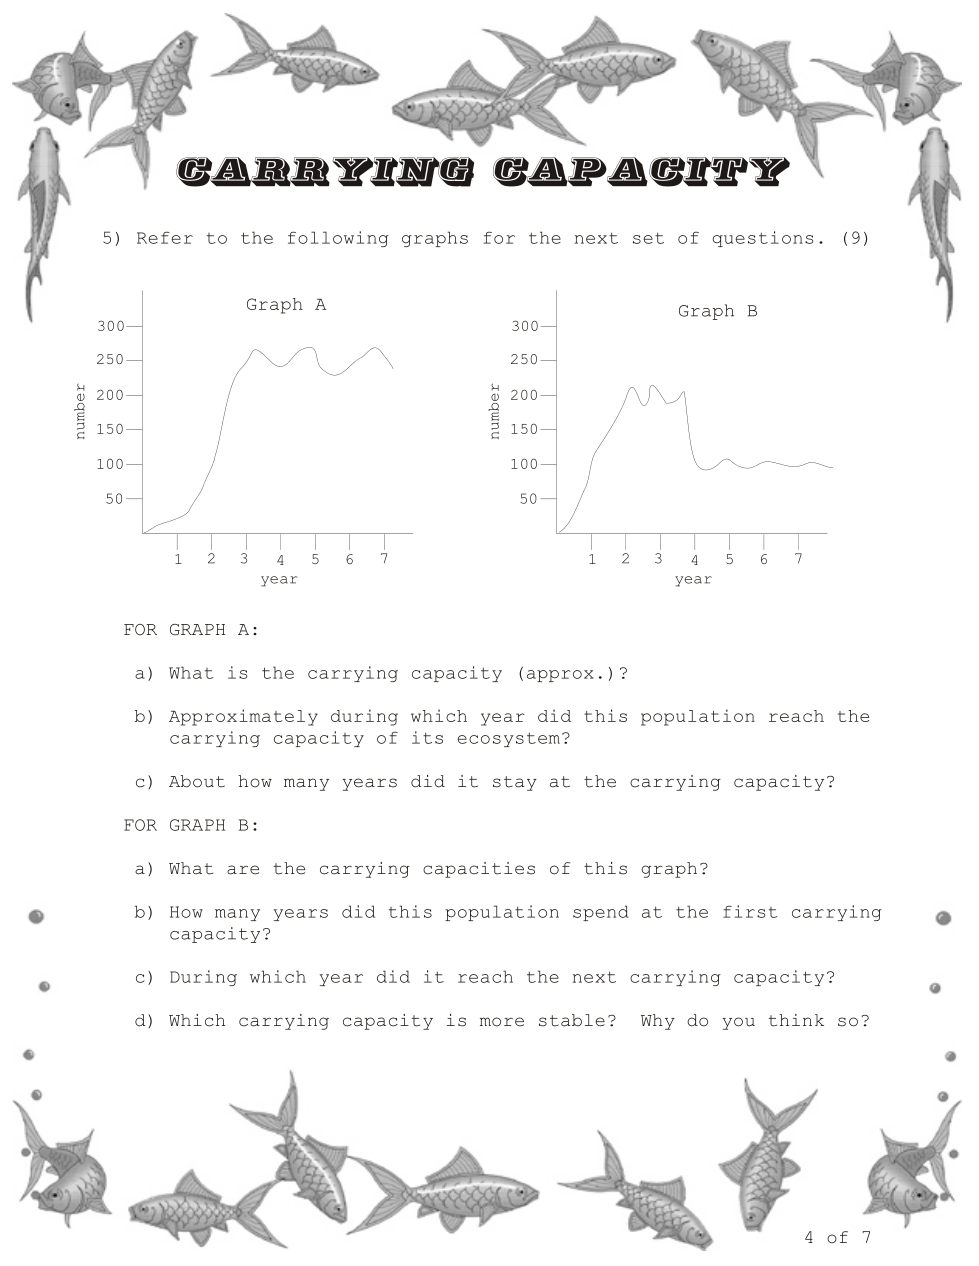
5a. Look at Graph A, what is the approximate carrying capacity?
Hint: use a trend line
5b. Look at Graph A, approximately during which year did this population reach the carrying capacity of its ecosystem?
5c. Look at Graph A, about how many years did it stay at the carrying capacity?
5a. Look at Graph B, what are the two carrying capacities?
5b. Look at Graph B, how many years did this population spend at the first carrying capacity?
5c. Look at Graph B, during which year did it reach the next carrying capacity?
5d. For graph B, which carrying capacity is more stable? Why do you think so? (Select 2)