Log in
Sign up for FREE
arrow_back
Library

3.08 Biotic Factors Lab: Coral Reefs Gizmo

star
star
star
star
star
Last updated about 3 hours ago
9 questions
1
1
4
HS-LS2-6
1
1
4
HS-LS2-6
1
1
4
HS-LS2-6
Before you can complete this assignment, you need to click here log in to Gizmos.
  1. Use ISWAewiner as the username.
  2. Select Biology B T3 as the class.
  3. Select your name from the student list.
  4. Select Gizmos.
  5. Enter your password.
  • Your password is the first letter of first name, full last name, grade number
  • Example: KMartin12
  • Include hypens, spaces, Jr, etc, if you have multiple parts in your last name. Examples: KDuncan-Martin12, K Martin Duncan, Kmartin Duncan III12
  • Still need help? E-mail ewiner@k12insightwa.org
In order to complete this assignment, you will need to use the Coral Reefs Gizmo. Click the link to open the Gizmo in a new tab.
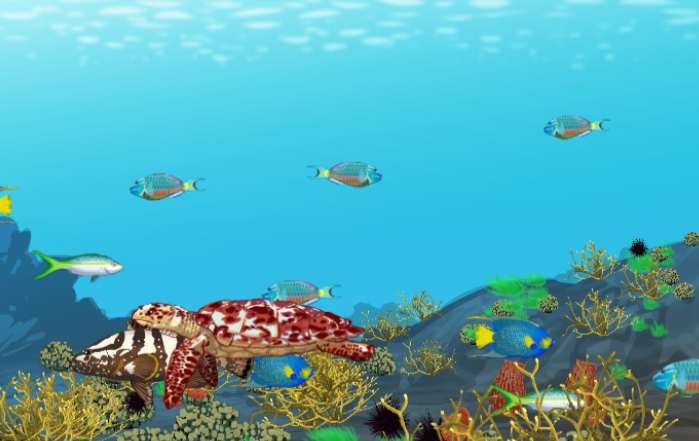
Like terrestrial environments, coral reefs can be damaged by invasive species. Reefs are also impacted by disease-causing bacteria, humans, and other biotic factors, or living parts of the ecosystem. In this Gizmo, you will explore how these factors affect coral reefs.
Question 1
1.

Question 2
2.

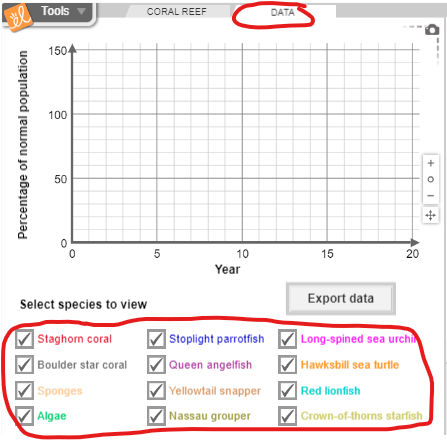
Click on the Data Tab and the select every species:


Take a screenshot of the data table and add it in the Show Your Work section.

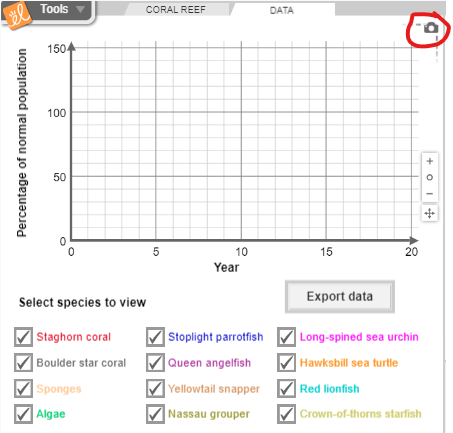
Click the camera icon located to the upper right side of the graph.

Use your mouse to right click and choose "Copy image."

Open the Show Your Work question.

Use Control + V on your keyboard for PCs (Command + V for Macs) to paste the graph into the box below.

Question 3
3.

Explain the data that your graph produced.
  • How did the fishing affect the coral reef community?
  • Which species increased in number?
  • Which species decreased in number?
  • Why do you think this happened?

Question 4
4.

Question 5
5.

Click on the Data Tab and the select every species:


Take a screenshot of the data table and add it in the Show Your Work section.

Click the camera icon located to the upper right side of the graph.

Use your mouse to right click and choose "Copy image."

Open the Show Your Work question.

Use Control + V on your keyboard for PCs (Command + V for Macs) to paste the graph into the box below.

Question 6
6.

Explain the data that your graph produced.
  • How did the disease affect the coral reef community?
  • Which species increased in number?
  • Which species decreased in number?
  • Why do you think this happened?

Question 7
7.

Question 8
8.

Click on the Data Tab and the select every species:


Take a screenshot of the data table and add it in the Show Your Work section.

Click the camera icon located to the upper right side of the graph.

Use your mouse to right click and choose "Copy image."

Open the Show Your Work question.

Use Control + V on your keyboard for PCs (Command + V for Macs) to paste the graph into the box below.

Question 9
9.

Explain the data that your graph produced.
  • How did the invasive species (lionfish) affect the coral reef community?
  • Which species increased in number?
  • Which species decreased in number?
  • Why do you think this happened?

Part 1: Fishing


On the CONDITIONS tab, select Fishing.

Set Net fishing to 50%.

Click Advance year 10 times.

What changes do you notice on the Coral reef tab?
More coral
Less algea
Less fish

Part 2: Disease


Click RETURN TO ORIGINAL SETTINGS, then RESTART.

On the CONDITIONS tab, select Disease.

Set Black band infection rate to 100%.

Click Advance year 10 times.

What changes do you notice on the Coral reef tab?
Less coral
More fish
More algae

Part 3: Invasive Species


Click RETURN TO ORIGINAL SETTINGS, then RESTART.

On the CONDITIONS tab, select Invasive Species.

Select the Red lionfish check box.

Click Advance year 10 times.

What changes do you notice on the Coral reef tab?
Less coral
More native fish
Less native fish