Before you can complete this assignment, you need to click here log in to Gizmos.
Use ISWAewiner as the username.
Select Biology B T3 as the class.
Select your name from the student list.
Select Gizmos.
Enter your password.
Your password is the first letter of first name, full last name, grade number
Example: KMartin12
Include hypens, spaces, Jr, etc, if you have multiple parts in your last name. Examples: KDuncan-Martin12, K Martin Duncan, Kmartin Duncan III12
Still need help? E-mail ewiner@k12insightwa.org
In order to complete this assignment, you will need to use the Natural Selection Gizmo. Click the link to open the Gizmo in a new tab.
Pre-Gizmo
The peppered moth (Biston betularia) is a common moth found in Europe, Asia, and North America.
It is commonly found in two forms, or morphs: a dark morph and a light, speckled morph.
Birds are a frequent predator of the peppered moth.
Question 1
1.
Which morph do you think would be easier to see on a dark tree trunk? __________
Which morph do you think would be easier to see on a light tree trunk? __________
Question 2
2.
Warm-up
The Natural Selection Gizmo allows you to play the role of a bird feeding on peppered moths. The initial population of 40 moths is scattered over 20 tree trunks.
How to play
Click play button and then Click on moths to capture them. Click the Next tree button (or the spacebar on your keyboard) to advance to the next tree.
Procedure
Check that LIGHT TREES is selected.
Click Play button and hunt moths for one year.
After one year is over click on the graph tab at top right to see results of capturing for one year.
Click on the button that says "Captured Moths"
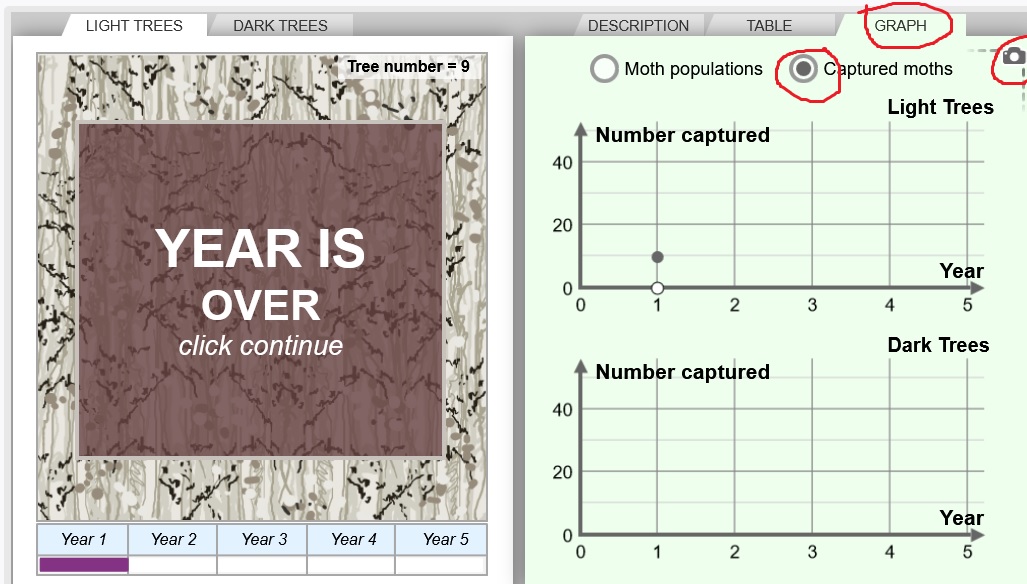
Take a picture of the graph. The camera button is in the top right corner of the graph.
Right click on the picture and "Copy Image"

Click in the free response box below and paste the image using Control + V (PCs) or Command + V (Macs)

Question 3
3.
Part 1
Question: How does the color of a peppered moth affect survival?
Introduction: Before the 19th century in England, the air was very clean. The bark on trees was usually light in color. Abundant lichens growing on tree trunks also lightened their appearance.
Question 4
4.
Predict for light colored trees:
Over time, the population of light moths will __________ and the population of dark moths will __________.
Question 5
5.
Experiment #1
Click Play and hunt peppered moths on light tree trunks for five years.
In each year, try to capture as many moths as you can. Note: You can use the spacebar on your keyboard to quickly advance to the next tree.
At the end of eachyear, you will need to click "Continue" to go to the next year and then the play button to play hunt again.
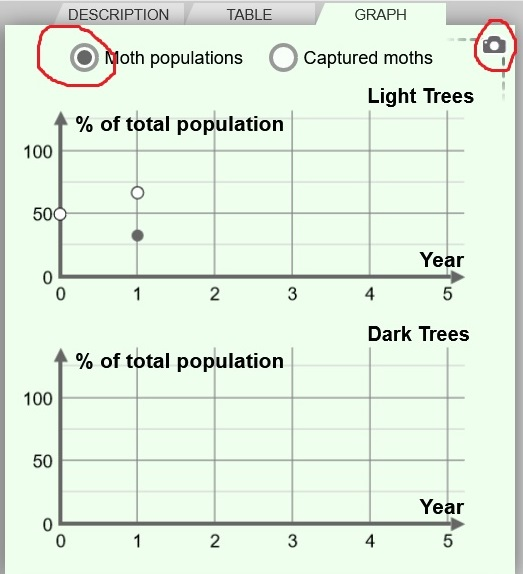
After 5 years, select the GRAPH tab and look at the percentages of each moth type population.
Click on the button that says "Moth Populations." (Note: The table shows current populations of each moth, not the number of captured moths.)
(Your graph should not look the same as mine. This is just an example and contains only one year of data)
Take a picture of the graph. The camera button is in the top right corner of the graph.
Right click on the picture and "Copy Image"�
Click in the free response box below and paste the image. You can right click and choose paste or use keyboard keys Control + V (PCs) or Command + V (Macs)
Question 6
6.
Results for light colored trees:
My data shows that overtime, the population of light moths __________ and the population of dark moths __________.
Part 2:
Introduction: The 19th century was the time of the Industrial Revolution in England. Most of the new industries used coal for energy, and the air was polluted with black soot. In forests near factories, the soot coated trees and killed lichens. As a result, tree trunks became darker.
Question: How did air pollution affect moth populations?
Question 7
7.
Predict for dark colored trees:
Over time, the population of light moths will __________ and the population of dark moths will __________.
Question 8
8.
Experiment #2
Click Play and hunt peppered moths on dark tree trunks for five years.
In each year, try to capture as many moths as you can. Note: You can use the spacebar on your keyboard to quickly advance to the next tree.
At the end of each year, you will need to click "Continue" to go to the next year and then the play button to play hunt again.
After 5 years, select the GRAPH tab and look at the percentages of each moth type population.
Click on the button that says "Moth Populations." (Note: The table shows current populations of each moth, not the number of captured moths.)
(Your graph should not look the same as mine. This is just an example and contains only one year of data)
Take a picture of the graph. The camera button is in the top right corner of the graph.
Right click on the picture and "Copy Image"
Click in the free response box below and paste the image. You can right click and choose paste or use keyboard keys Control + V (PCs) or Command + V (Macs)

Question 9
9.
Results for dark colored trees:
My data shows that overtime, the population of light moths __________ and the population of dark moths __________.
Question 10
10.
Question 11
11.
Claim: Natural selection is the process by which favorable traits tend to increase in frequency over time.
Evidence: How does this experiment illustrate natural selection?
(use the data that you clollected in the graphs to support your answer)
If a forest contained mostly light-colored trees, which type of moth would you expect to be most common?
Light
Dark
Both
Neither
How did the changes in the moth populations occur?
Individual moths changed color in response to their environment.
The best-hidden moths survived and reproduced to pass on their traits to their offspring.