For this formative, there will be stations scattered throughout the classroom. Each station corresponds to a set of questions for this formative. Some stations will be hands-on, online, or a hybrid of both, but you will be graded on the content in this formative. Questions in Red are done at the stations.
Hydrosphere & Cryosphere:
Using the data you collected in the simulation, create a bar graph to display your information. Make sure to include labels, units, numbers.

Geosphere:
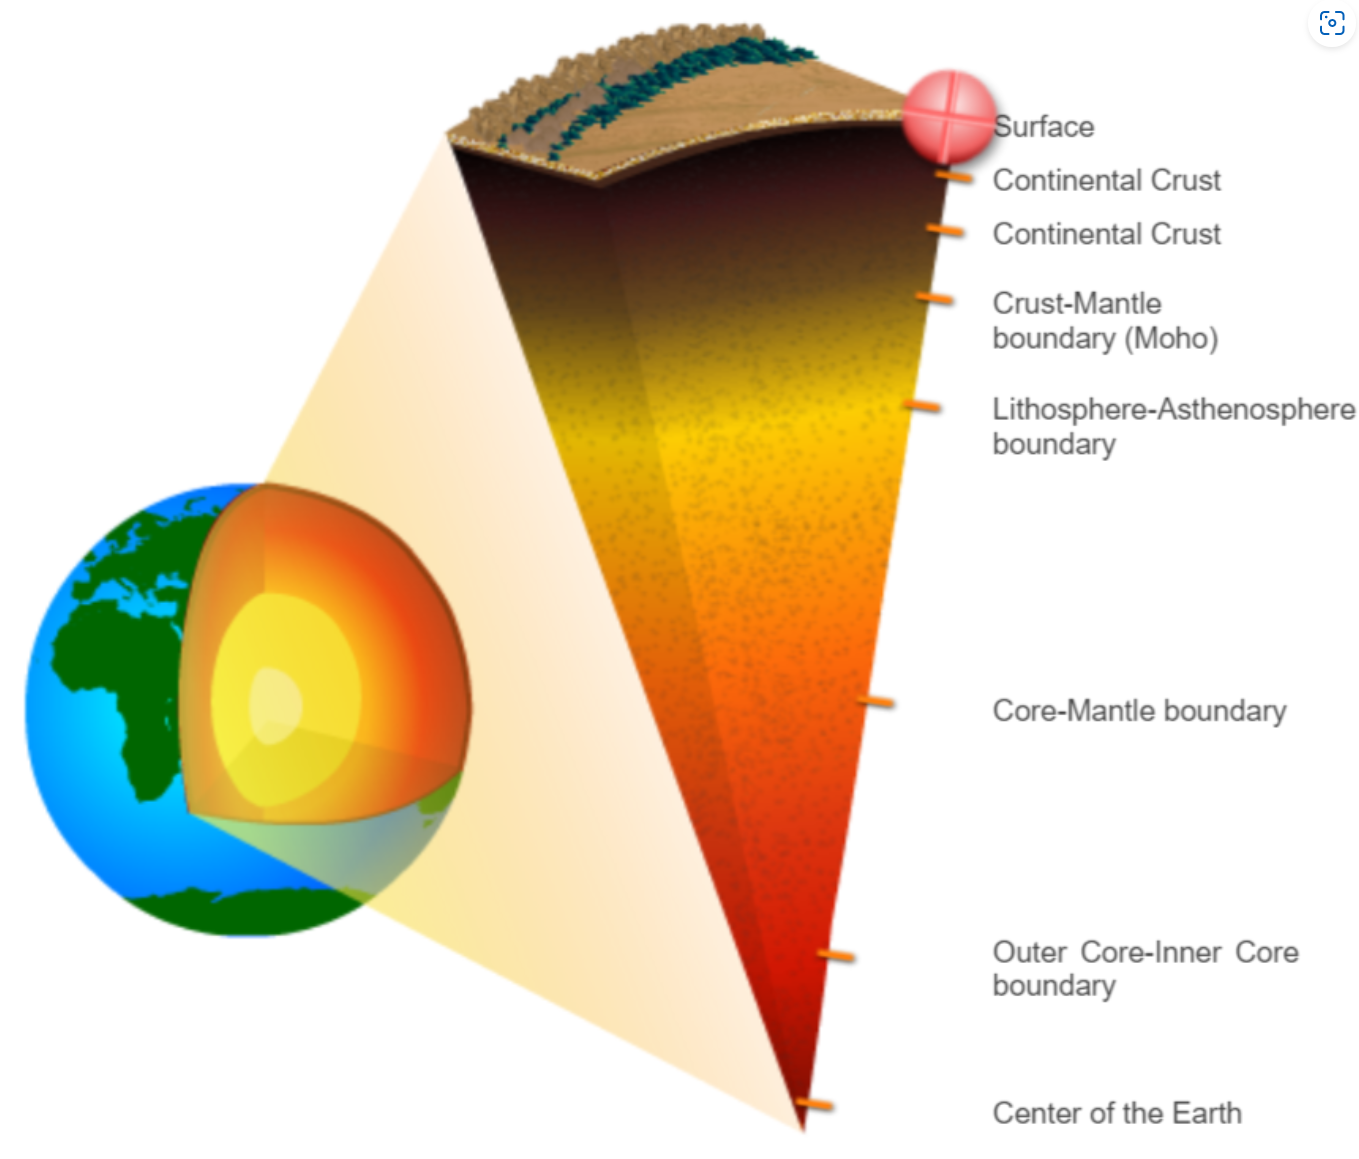
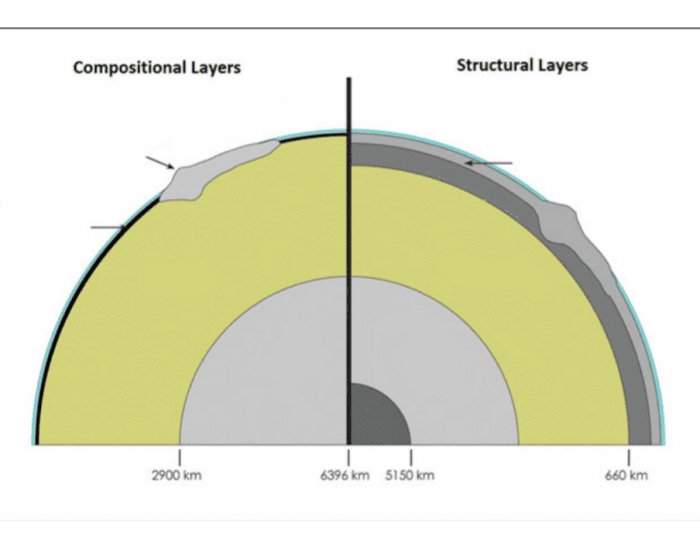
Using the data you collected in the simulation, fill in the blanks for each of the eight different depths noted in the simulation and the image. (Depth in Kilometers, Temperature in Celsius)
Surface
Depth:
Continental Crust (1)
Depth:
Continental Crust (2)
Depth:
Crust-Mantle Boundary
Depth:
Lithosphere-Asthenosphere Boundary
Depth:
Core-Mantle Boundary
Depth:
Outer Core-Inner Core Boundary
Depth:
Center of the Earth
Depth:
As we move closer to the center of the Earth, temperature will
Atmosphere:
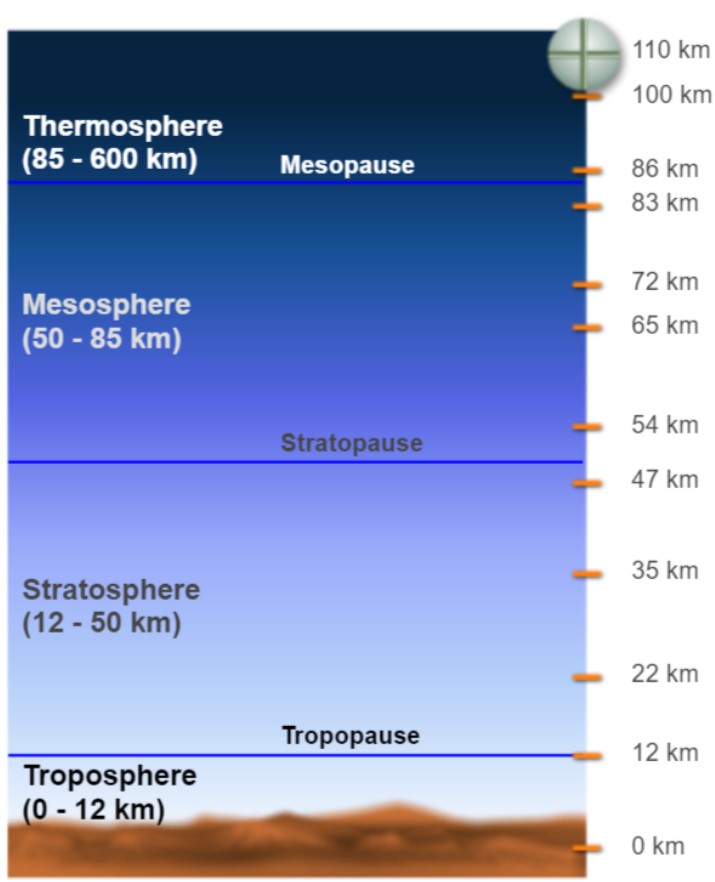
Using the data you collected in the simulation, fill in the blanks for each of the eight different altitudes noted below. (Altitude in Kilometers, Pressure in mb, Temperature in Celsius)
Altitude of 0 km
Pressure:
Altitude of 12 km
Pressure:
Altitude of 35 km
Pressure:
Altitude of 47 km
Pressure:
Altitude of 54 km
Pressure:
Altitude of 65 km
Pressure:
Altitude of 86 km
Pressure:
Altitude of 110 km
Pressure:
As altitude in the atmosphere increases, pressure will
Biosphere:
Select and observe 3 different live cams (except Monterey Bay Cam) from the Monterey Bay Aquarium website.
1st Cam:
2nd Cam:
3rd Cam:
Biosphere:
Using the 3 live cams you selected, name as many organisms as you can that you observed.
Biosphere:
What are some of the notable/interesting behaviors from the animals that you observed?
Magnetic Fields Station:
Position the magnet in a way that demonstrates a magnetic field and sketch it.
Use this example to draw a magnetic field around the Earth.
Earth's Polarity:
Using the two posters (Poster A and Poster B) for this station, run a compass across them from left to right.
What did you notice is different between the two posters?
Earth's Polarity:
Read the webpage displayed on the side of this question that explains the shift in the polarity of Earth.
How did scientists discover that the polarity of Earth is reversed every few thousands of years?
With the information from the station and the reading, I can predict that has an ocean that is above a mid-ocean ridge.
Match the term with its proper description.
| Draggable item | arrow_right_alt | Corresponding Item |
|---|---|---|
Sublimation | arrow_right_alt | Matter changes from a gas to a liquid as it loses heat energy. |
Condensation | arrow_right_alt | Matter changes from a liquid to a solid as it loses heat energy. |
Freezing | arrow_right_alt | Matter changes from a solid to a liquid as it gains heat energy. |
Vaporization | arrow_right_alt | Matter changes from a solid to a gas as it gains heat energy |
Melting | arrow_right_alt | Matter changes from a liquid to a gas as it gains heat energy. |
Select the four incorrect/inaccurate statements by clicking on the sentences.
Which statements are accurate descriptions of Earth's magnetic field? Select all that apply.
Match each sphere with the correct description.
| Draggable item | arrow_right_alt | Corresponding Item |
|---|---|---|
Hydrosphere | arrow_right_alt | Describes the solid exterior and interior of Earth. |
Biosphere | arrow_right_alt | Describes all water on the planet: solid, liquid and gas. |
Geosphere | arrow_right_alt | The gaseous mixture of air at the planet's surface. |
Atmosphere | arrow_right_alt | Consists of all living things on Earth plus the nonliving things that make up their environments. |
Match each layer of the geosphere with the correct label.

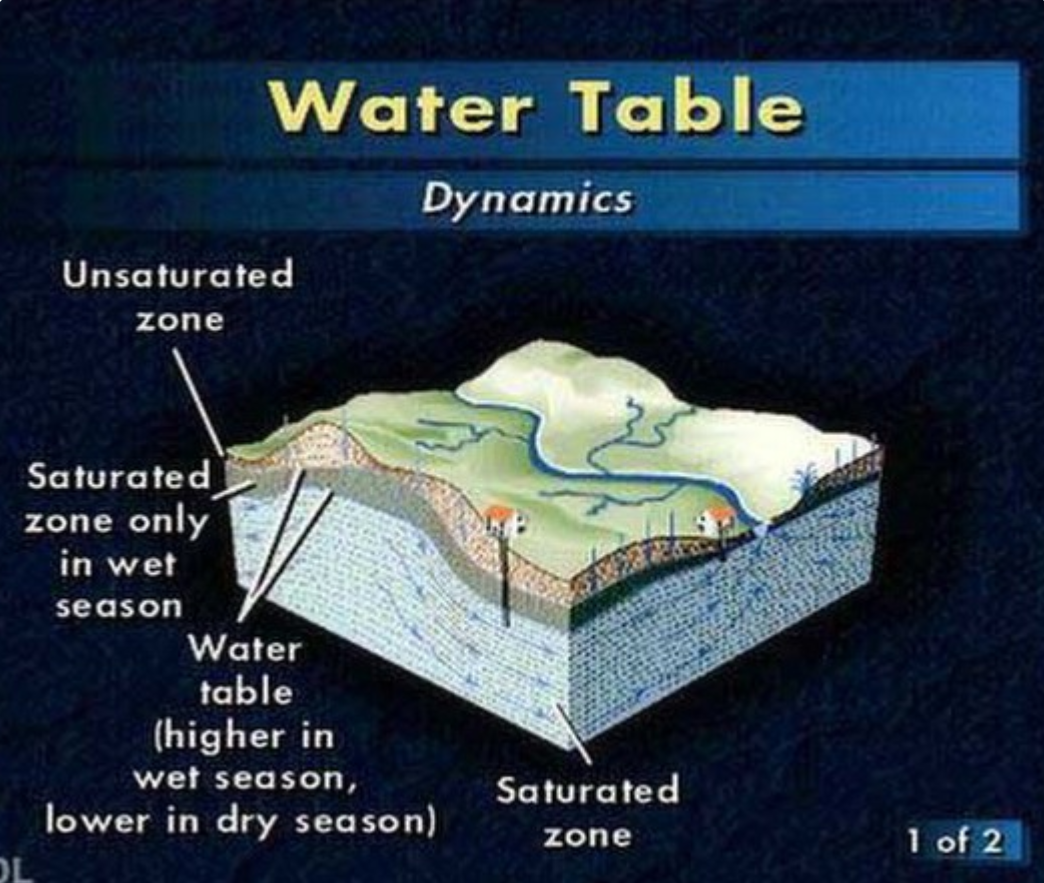
Groundwater is a freshwater reservoir found underground between soil and rock layers. Use the diagram above to determine which of the following is also known as the Zone of Aeration.
Saltwater accounts for of water on the planet. About of dissolved solids in ocean water is chlorine, and about is sodium. The remaining of water on the planet's surface is freshwater, with around of that being groundwater.
Which is NOT an example of a greenhouse gas?
Earth’s

Secondary Succession:
The ecological event that disrupted the ecosystem in the simulation was a
Complete the quiz within the Succession Interactive, and upload a screenshot of your score.

Snakes are and belong to the trophic level .
Mice are and belong to the trophic level .
Hawks are and belong to the trophic level .
Orchids are and belong to the trophic level .
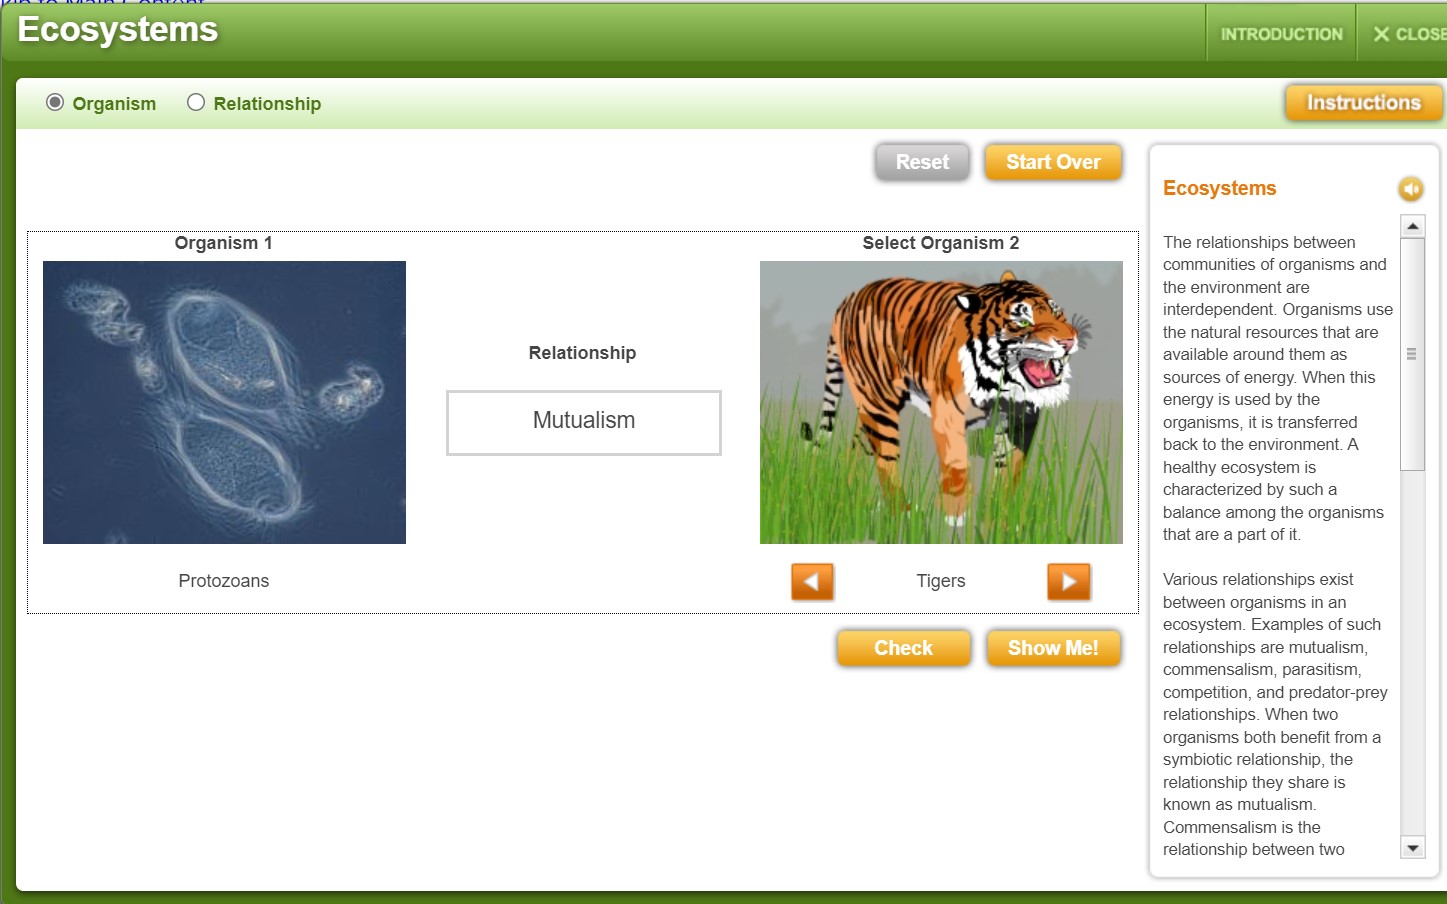
Ecosystems Simulation
On the "Organism" tab, find the corresponding Organism 2 that follows the type of relationship noted for Organism 1. Click "Start Over" to change to a different set of organisms.
Organism 1 Relationship Organism 2
Bees Mutualism
Snakes Predation
Leopards Competition
Orchids Commensalism
Mosquitos Parasitism
Ecosystems Simulation
On the "Relationship" tab, find the corresponding relationship between two organisms. Click "Start Over" to change to a different set of organisms.
Organism 1 Relationship Organism 2
Remoras Sharks
Deer Zebras
Hawks Mice
NFB Leguminous Plants
Hornworms Tomatoes
Classify the following as characteristics of a biome or a community.
May include one or more ecosystems
Ecosystem may include one or more
Comprises only living things
Includes mostly interacting organisms
Includes living and non-living things
Includes organisms that may or may not interact
Mojave desert animals such as including coyote, rattlesnake, tortoise and others
A typical desert
Biome
Community
Scientists recognize populations, communities, and ecosystems as different levels of a hierarchy of life on Earth, which can be represented by a diagram of concentric circles. Drag each system described to its correct classification in the hierarchy: population, community, or ecosystem.
The group of raccoons living in the park
The grass and flowers in a school playground
The snakes and cacti in a desert
The pond at the park and the organisms living in it
The pine trees growing in New York City
Population
Community
Ecosystem
A leech feeding off of human blood is an example of . A group of egrets that live near cattle to feed off of insects disturbed by the cattle are an example of . Two species of ants that feed on the same source of nectar are an example of . Bacteria that feed off of food in the human gut and provide essential nutrients to their host are an example of . A bobcat feeding off of rabbits in the ecosystem is an example of .
Match the trophic level with the correct description.
| Draggable item | arrow_right_alt | Corresponding Item |
|---|---|---|
Omnivore | arrow_right_alt | organisms which carry out the process of decomposition by breaking down dead or decaying organisms |
Decomposer | arrow_right_alt | organisms which carry out the process of decomposition by breaking down dead or decaying organisms |
Autotroph | arrow_right_alt | an animal that consumes only plants |
Detritivore | arrow_right_alt | an organism that cannot synthesize its own food from simple substances |
Carnivore | arrow_right_alt | an animal that eats plants as well as other animals |
Herbivore | arrow_right_alt | an animal that consumes other animals |
Heterotroph | arrow_right_alt | an organism that can synthesize its own food |
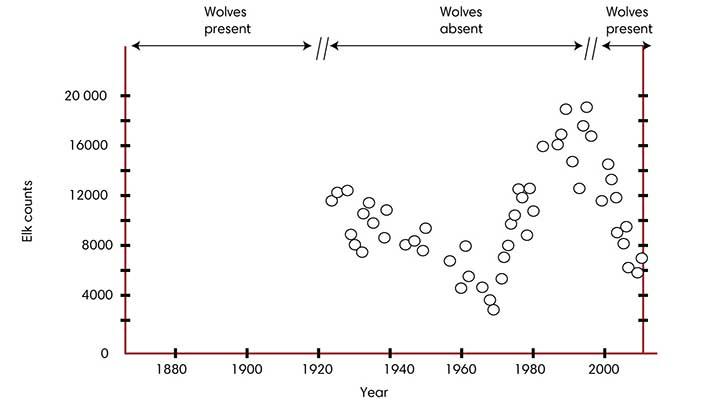
During the early 20th century, wolves were wiped out from Yellowstone. However, in 1995, wolves were reintroduced to Yellowstone. How did removing then reintroducing wolves affect the Yellowstone ecosystem?

Wolves are a and removing them ecosystem. Shown in the graph, the Elk population at first, then rapidly. After wolves were reintroduced to the ecosystem, we saw how the Elk population began to drastically .
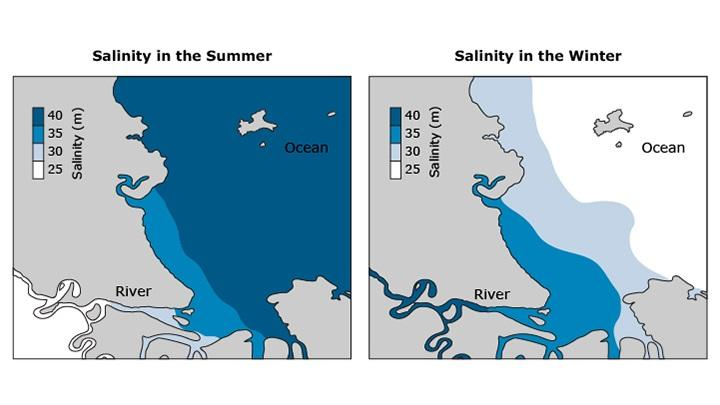
The graphs below show the salinity in an estuary where a river meets the ocean. Panel A shows the salinity in summer months, and panel B shows the salinity in winter months. Choose the correct word or phrase to explain the change in salinity between summer and winter.
In the summer, the salinity is in the ocean than in the river. In the winter, the salinity is in the ocean than in the river. The reason for these gradients is that the river freezes in the winter, so .
The organisms within a
Classify the following as either abiotic or biotic factors by dragging them to the correct block.
predators
prey
sunlight
temperature
parasites
precipitation
Abiotic Factors
Biotic Factors
Which of the following is incorrect about population growth?
Match the following terms with the definitions below.
| Draggable item | arrow_right_alt | Corresponding Item |
|---|---|---|
community | arrow_right_alt | large geographic regions characterized by the same climate and plant and animal populations |
biome | arrow_right_alt | all individuals of a species living within a given area |
species | arrow_right_alt | the interaction between the abiotic and biotic parts of the environment |
ecosystem | arrow_right_alt | populations of different species interacting with one another |
population | arrow_right_alt | organisms that can breed and produce fertile offspring. |
The size of a population can be used to determine both the health of the given
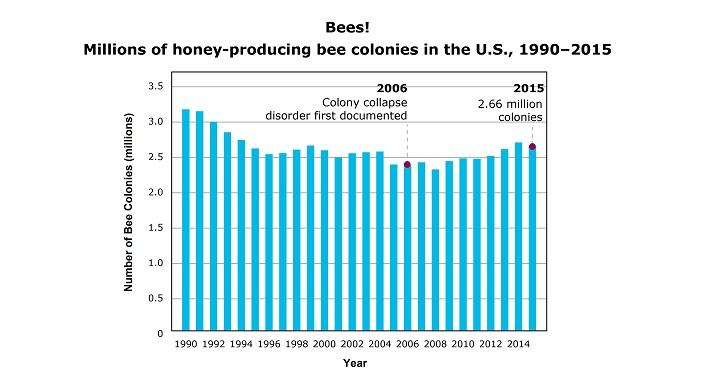
Between 1987 and 2015 the number of honey-producing bee colonies in the United States has changed due to mass die-offs and efforts to combat them. Study the graph and then choose the correct word from each drop-down menu to describe the U.S. honeybee population.
In 2006, beekeepers in the US noticed that more bees in their colonies were dying than had in previous years. At this time, the population growth rate of honeybees in the US was . In the years that followed, scientists studied the causes of the die-offs, and beekeepers took steps to replace the lost colonies. At the end of 2015, the honeybee population was higher than it was in 2006, so the population growth rate from 2006 to 2015 was .
Honeybees in the wild and in honey-producing colonies have a distribution. However, honeybee populations are in commercial honey-producing colonies than in the wild.
Select the sentence in this paragraph that explains why infectious diseases are density-dependent.
Some factors that impact populations depend on the population's density, and others do not. Drag each factor into the correct row.
a new predator is introduced into an ecosystem
The supply of prey for a predator in an ecosystem decreases
a contagious virus infects a population
a factory releases toxic waste into a stream
the food supply for a population shrinks
an earthquake occurs in California
heavy rains cause floods
Density-Dependent Factors
Density-Independent Factors
Exponential growth of a population occurs when the growth rate is
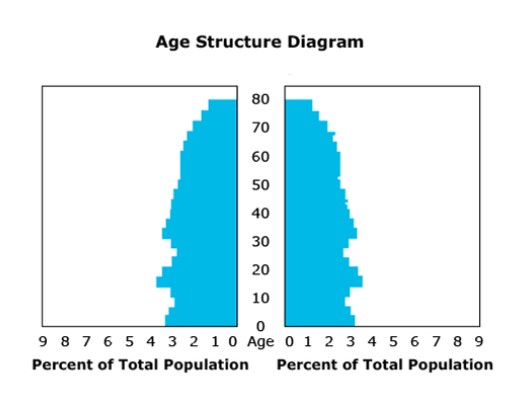
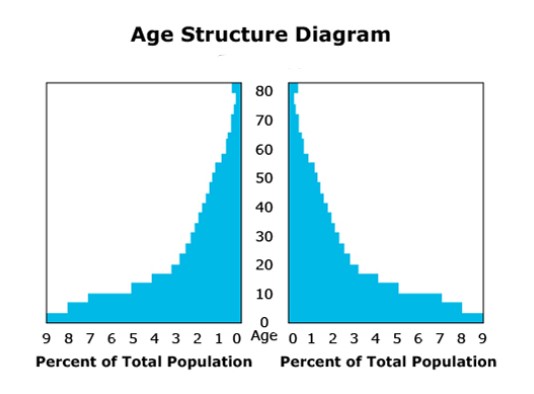
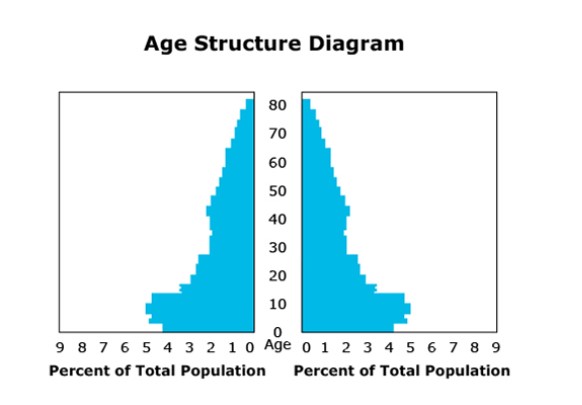
Match the image with the correct type of population.
| Draggable item | arrow_right_alt | Corresponding Item |
|---|---|---|
| arrow_right_alt | Stationary Age Structure |
| arrow_right_alt | Declining Age Structure |
| arrow_right_alt | Exponential Age Structure |
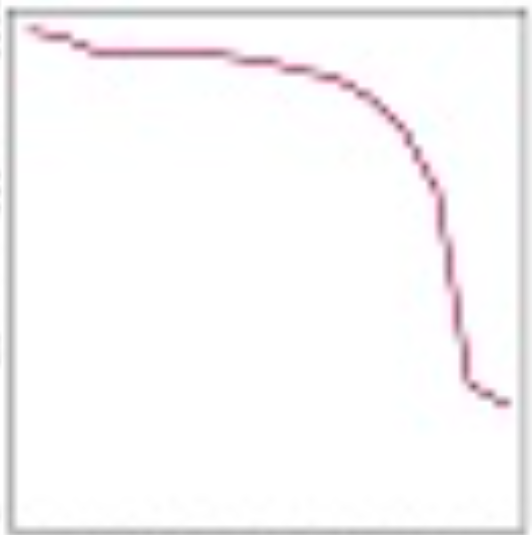
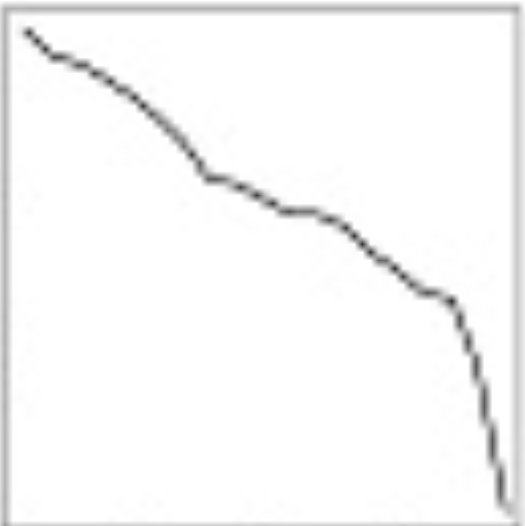
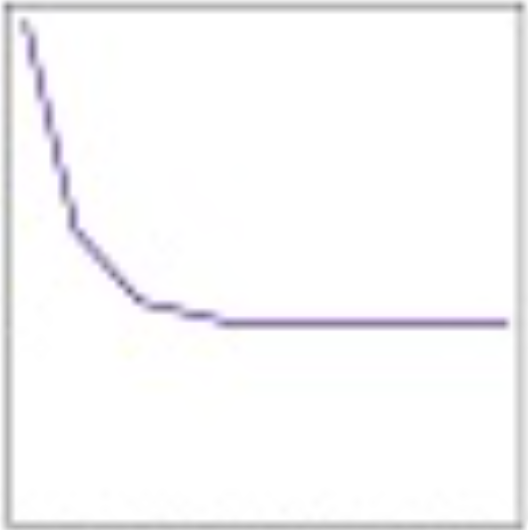
Each type of survivorship curve has a distinct shape. Match each graph with the scenario it best describes.
| Draggable item | arrow_right_alt | Corresponding Item |
|---|---|---|
Many species of hawks lay between one and five eggs every year. They care for these young until they leave the nest. | arrow_right_alt | |
Sea turtles lay an average of 100 eggs in a nest, and nest up to 8 times a year. Many of these turtles die before reaching adulthood. | arrow_right_alt | |
Female grizzlies give birth to one or two cubs, who stay with their mother for two to three years. Grizzlies can live to be 25 years old in the wild. | arrow_right_alt |
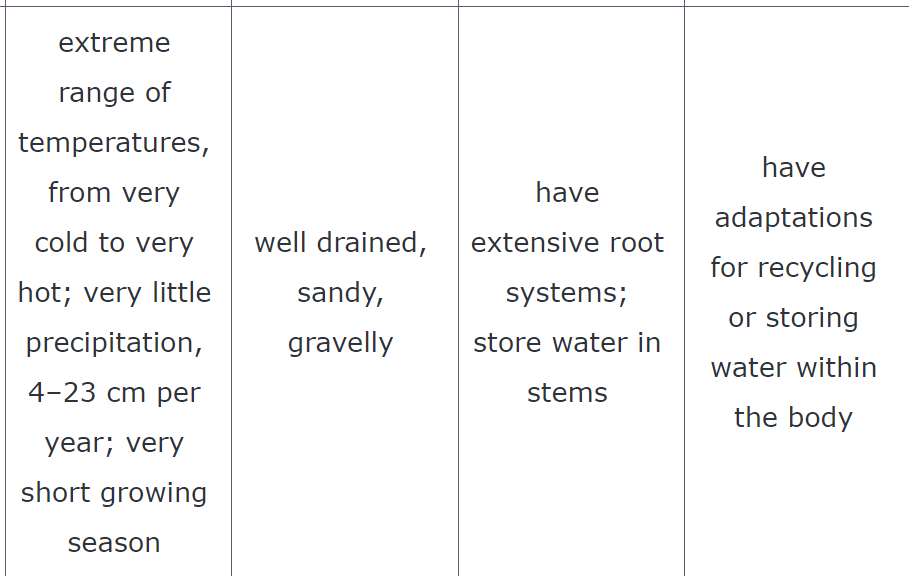
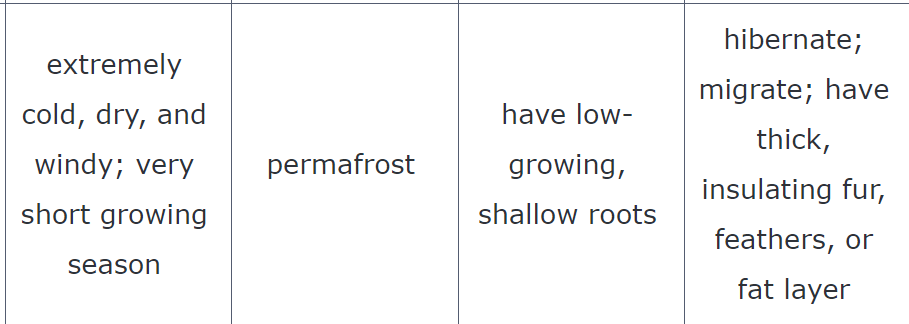
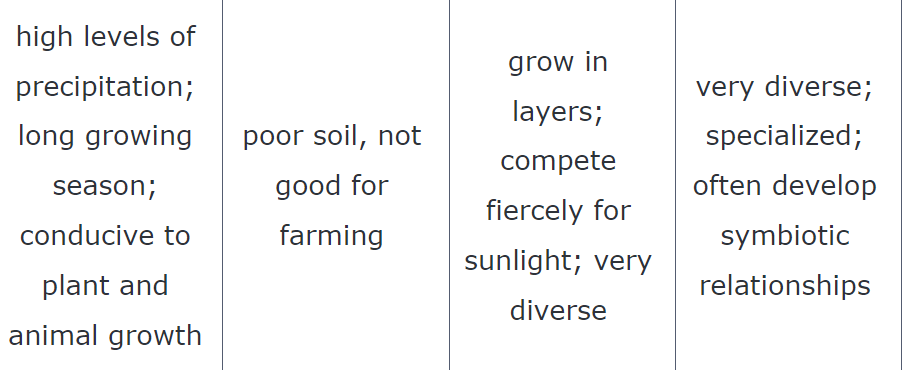
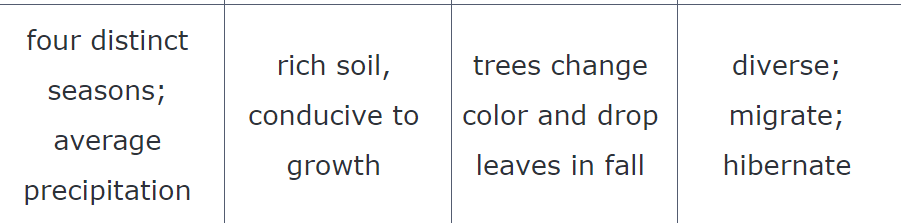
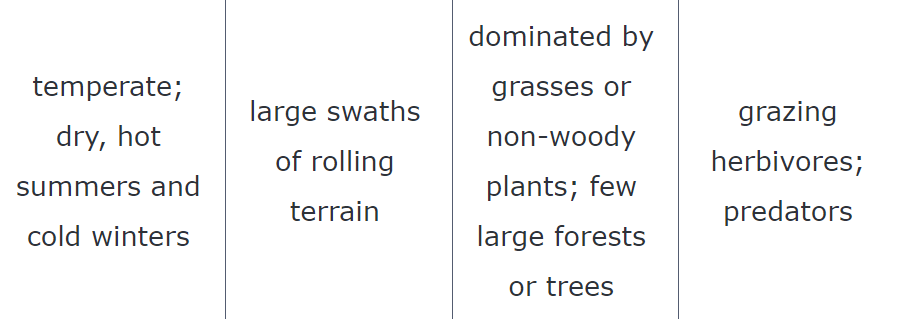
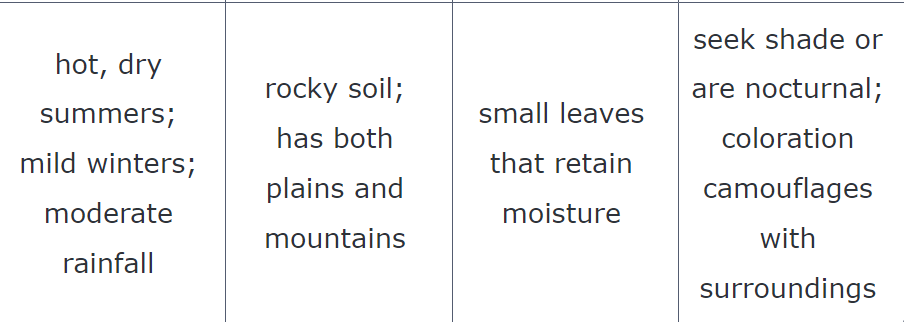
Analyze the characteristics to determine which biome they describe. Then, drag and drop the name of the biome into that row.
| Draggable item | arrow_right_alt | Corresponding Item |
|---|---|---|
deciduous forest | arrow_right_alt | |
desert | arrow_right_alt | |
taiga | arrow_right_alt | |
chaparral | arrow_right_alt | |
rain forest | arrow_right_alt | |
grassland | arrow_right_alt |
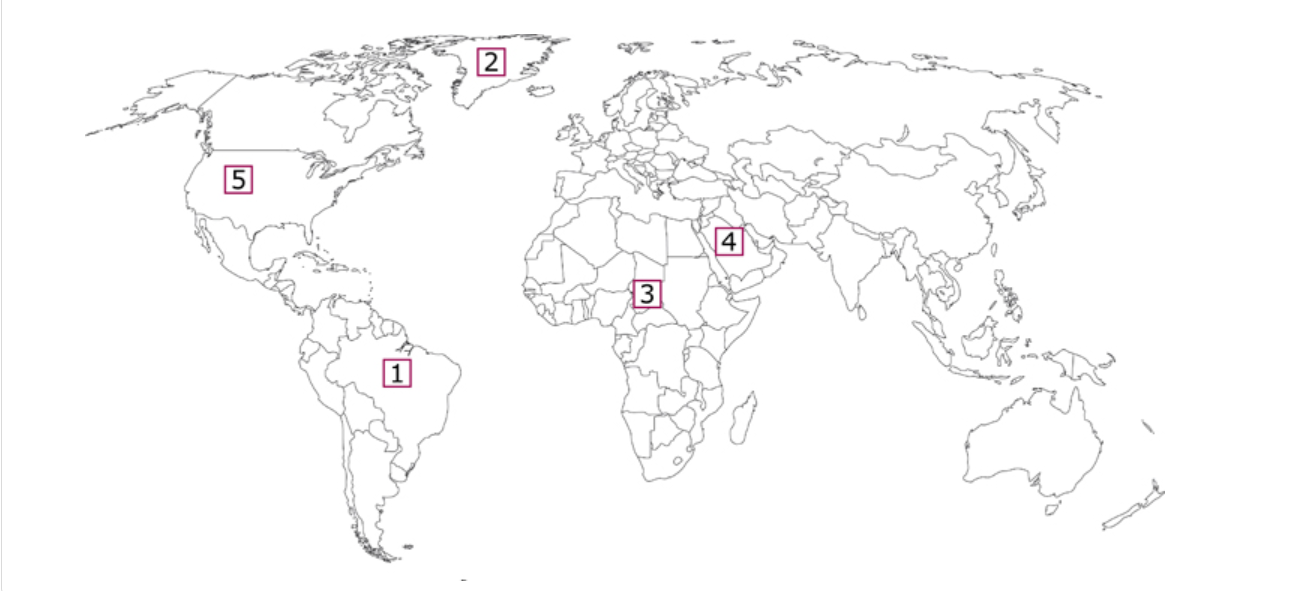
Match the climate description to the number that corresponds to the correct location on the map.
1:
2:
3:
4:
5:
Match each biome name to its sample plant and animal.
| Draggable item | arrow_right_alt | Corresponding Item |
|---|---|---|
desert | arrow_right_alt | oak tree, deer |
tundra | arrow_right_alt | barrel cactus, reptiles |
deciduous forest | arrow_right_alt | zebras, elephant grass |
temperate grassland | arrow_right_alt | kapok tree, monkeys |
tropical rainforest | arrow_right_alt | arctic moss, caribou |
Aquatic biomes are classified as either freshwater or marine. Drag each biome into the correct row. Think carefully: some biomes may fit in either location! Make sure you look up the definitions of any words you do not already know.
river
bay
swamp
shore
shallow sea
stream
estuary
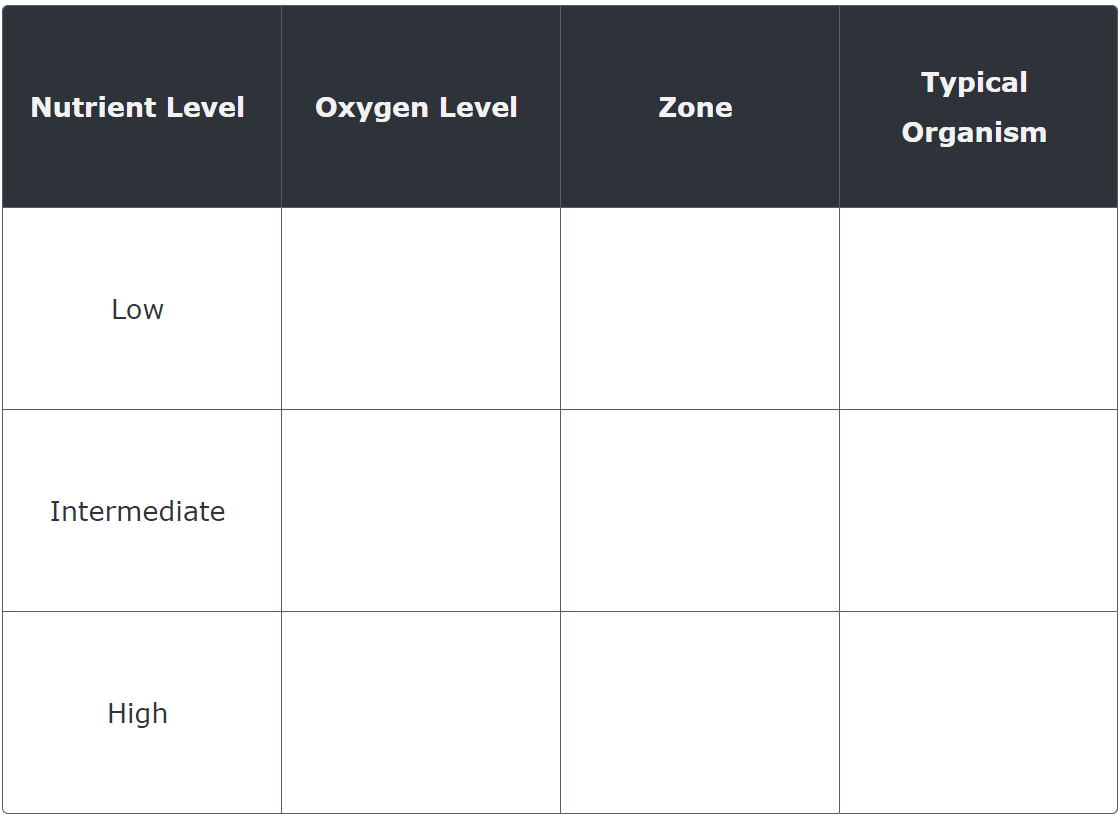
The nutrient content and oxygen levels in streams and rivers often change from one part to another. Drag and drop the tiles to match the relative oxygen levels and zones of the river to its corresponding nutrient levels. Also, place the picture of an organism that would most likely inhabit each zone.
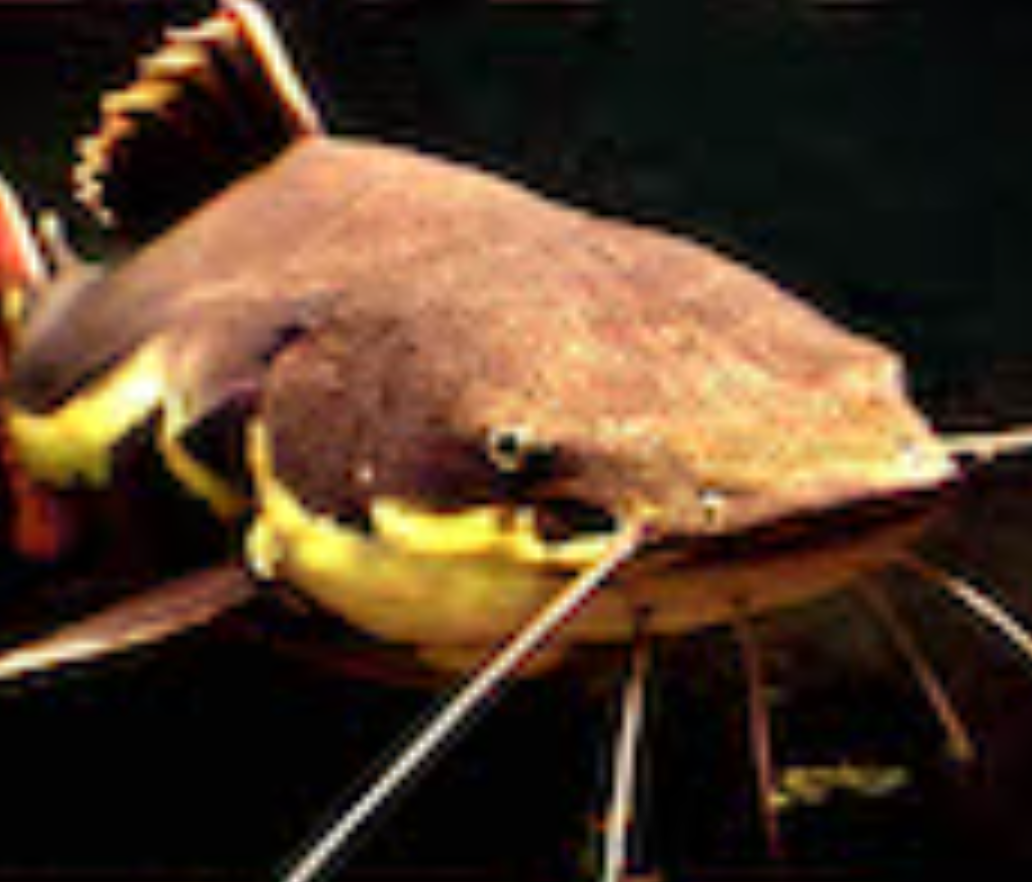
Catfish
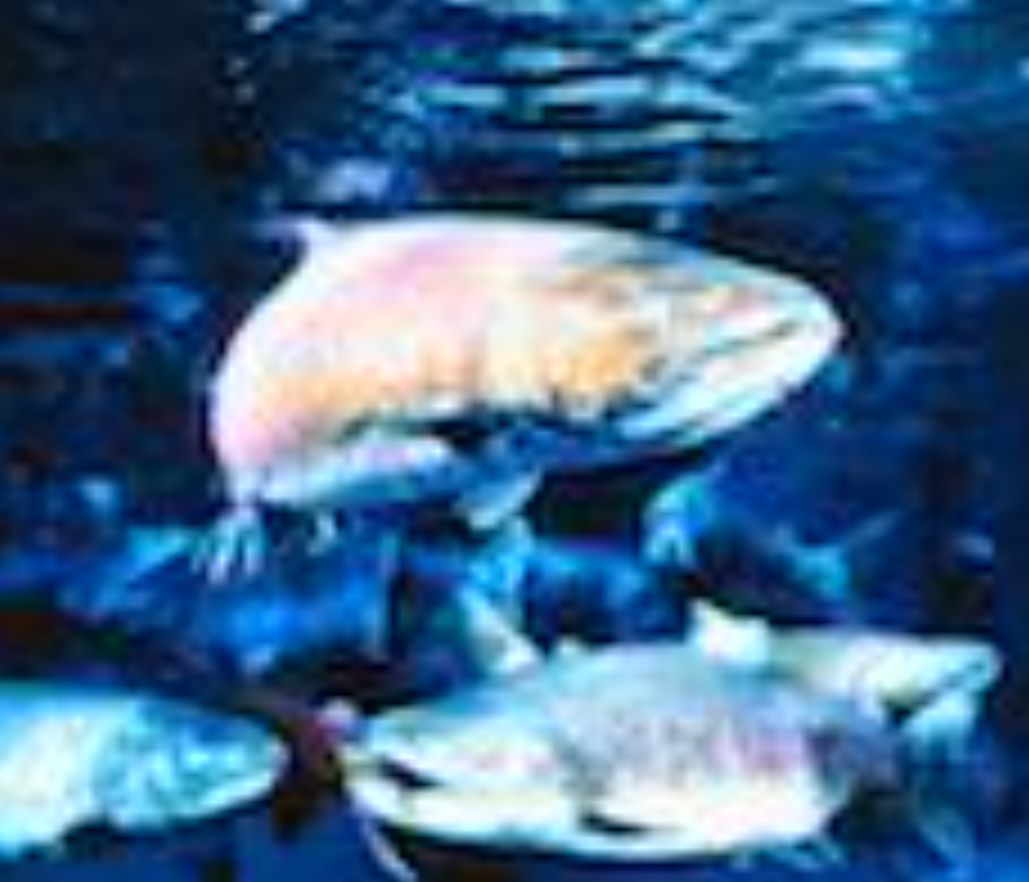
Salmon
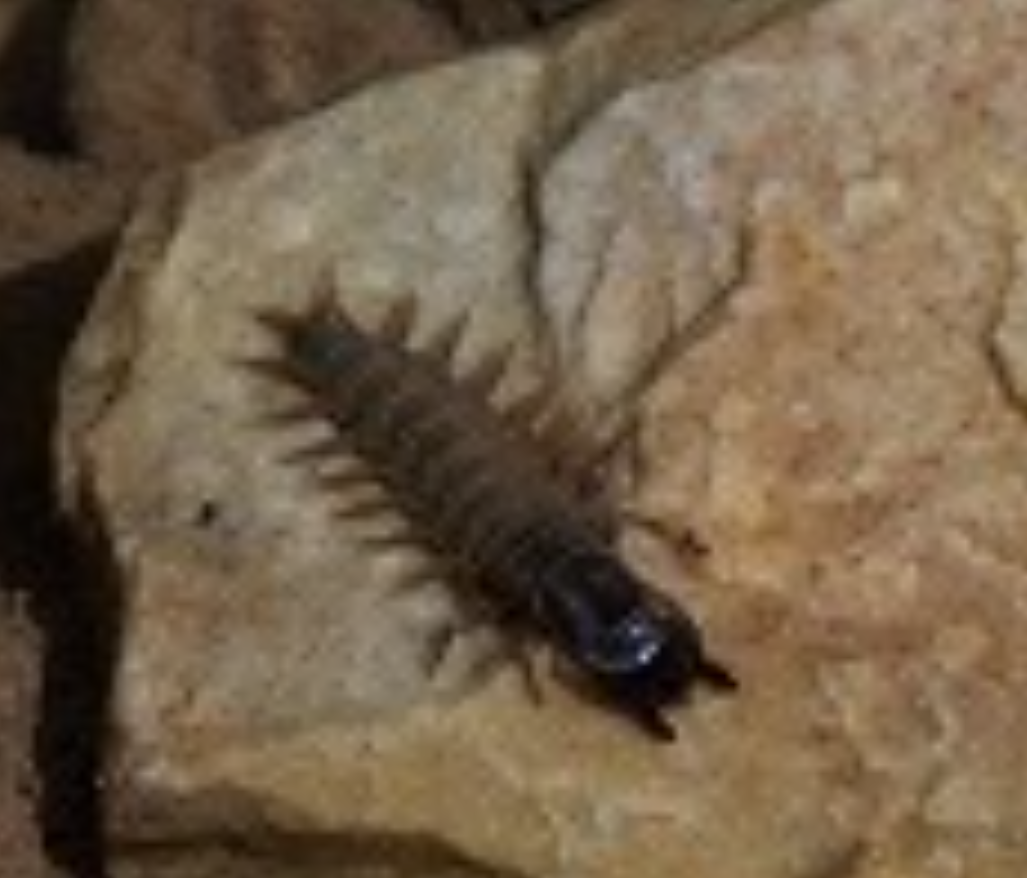
Hellgrimmite
Succession Simulation
For Primary Succession, identify what your pioneer species is, and then list each of your organisms in order of when they colonized your island.
Pioneer Species:
After Pioneer Species:
1)
2)
3)
4)
5)
6)
7)
8)
9)
For Secondary Succession, since your island already has soil, choose a different pioneer species, and list the order of organisms that colonized this island.
Pioneer Species:
After Pioneer Species:
1)
2)
3)
4)
5)
6)
7)
8)
9)