Linear Functions Review - Day 1
star
star
star
star
star
Posljednje ažuriranje over 3 years ago
11
1
1
1
1
1
1
1
1
1
1
1
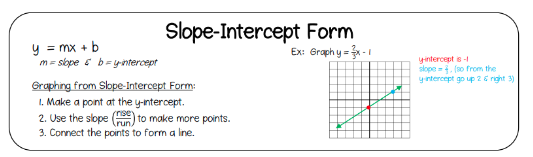
Which graph represents
The linear function representing the graph can be written y=


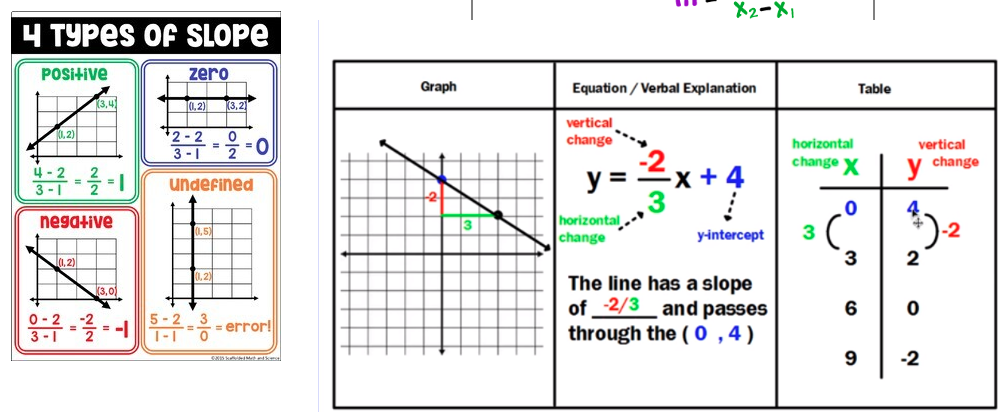
What is the slope of this linear function?
Find the slope between the points (-3,8) and (5,-2). Use the slope formula
TEST CHALLENGE: What is the slope of this linear function?

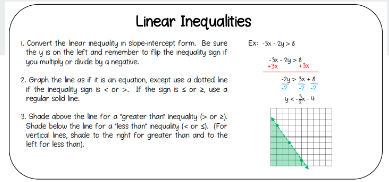
-7 + -1n < -9
Graph
For the above question, the shading will be the line, and the line will be
TEST CHALLENGE: SOLVE THIS COMPOUND INEQUALITY

Which of the trees is growing at a faster rate?

TEST CHALLENGE: What tree was the tallest when it was first planted?