Air Pressure Simulation (SJ)
star
star
star
star
star
Posljednje ažuriranje over 3 years ago
23 questions
1
1
1
1
1
1
1
1
1
2

1
1

1
1
1
1
1
1
1
1
1
4
4
1. Press the air pump 2-3 times to put more molecules into the container until the air pressure is 4 atm.
2. Press the down arrow next to the word "volume" to decrease the volume to about 300 L.
What is the temperature of the air at this pressure?
Press the "Heat" button on the left side of the screen and let it run until you have reached the maximum heat. What is the maximum temperature of the air?
What happened to the volume of the gas as the temperature went up? (HINT: Look at the volume gauge...what is the new volume?)
What happened to the density of the molecules when you increased the temperature? (HINT: The number of molecules did not change, but what did change?)
What is the new air pressure?
Press the "cool" button that is on the left side of the screen. What is the new temperature of the air?
What is the new volume of the container?
What happened to the volume of the gas when you cooled it down?
Did the density of the molecules increase or decrease when the temperature dropped? (HINT: The number of molecules did not change, but what did change?)
Describe how changing the temperature of the air affected it's density.
Make a prediction: what do you think will happen when you click "remove divider" in the simulation?
AFTER WRITING YOUR PREDICTION press the "Remove Divider" button. What happened when you removed the divider? Why do you think that happened?
Make a new prediction: What do you think will happen once the divider is removed?
AFTER MAKING YOUR PREDICTION: Press "Remove Divider" and select what happened.
Which direction did most of the molecules flow to?
If the blue and red molecules represent cold and warm air masses, why do you think the molecules flowed in the direction that they did?
The grey dots represent air molecules. Click the side you think has higher air pressure.
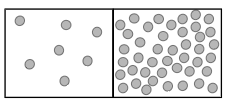
Click the side you think has lower air pressure.
If you were to remove the wall between the air masses, which direction would the molecules flow?
Now, let's relate the simulation to how air masses move in the troposphere. Click the area where air pressure is low.
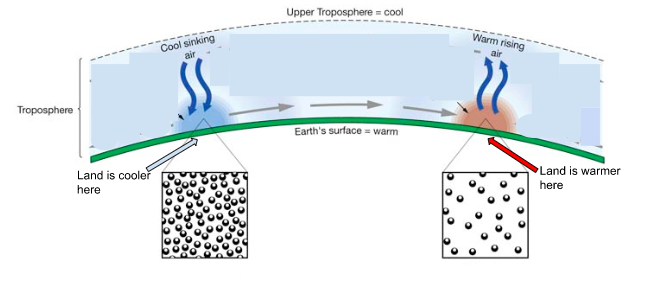
Now, let's relate the simulation to how air masses move in the troposphere. Click the area where air pressure is high.
Pull it all together...
How do you know which part of the diagram is a low-pressure area and which part of the diagram is high-pressure? (HINT: Think about how the temperature in the first simulation affected density.)
The low-pressure side is , so the molecules are densely packed. The high-pressure side is , so the molecules are densely packed.
The arrows in the middle of the diagram represent wind. Explain how differences in air pressure create wind. Use complete sentences when answering this question.
Include the following in your answer:
temperature
density
low-pressure
high-pressure


