Preskoči na glavni sadržaj
Prijava
Sign up for FREE
arrow_back
Biblioteka

5.7 Classwork: Analyzing the Great Depression - 2022/2023

star
star
star
star
star
Posljednje ažuriranje almost 2 years ago
16
Napomena autora:

Content Objective: I will be able to understand the relationship between the consumerism of the 1920s and the Great Depression.

Standard Objective: I will be able to draw connections between events (cause/effect).

Absent? Just want to review the slides? Click here for the slides from today.

Content Objective: I will be able to understand the relationship between the consumerism of the 1920s and the Great Depression.

Standard Objective: I will be able to draw connections between events (cause/effect).

Absent? Just want to review the slides? Click here for the slides from today.

Obavezno
1
Obavezno
1
Pitanje 1
1.

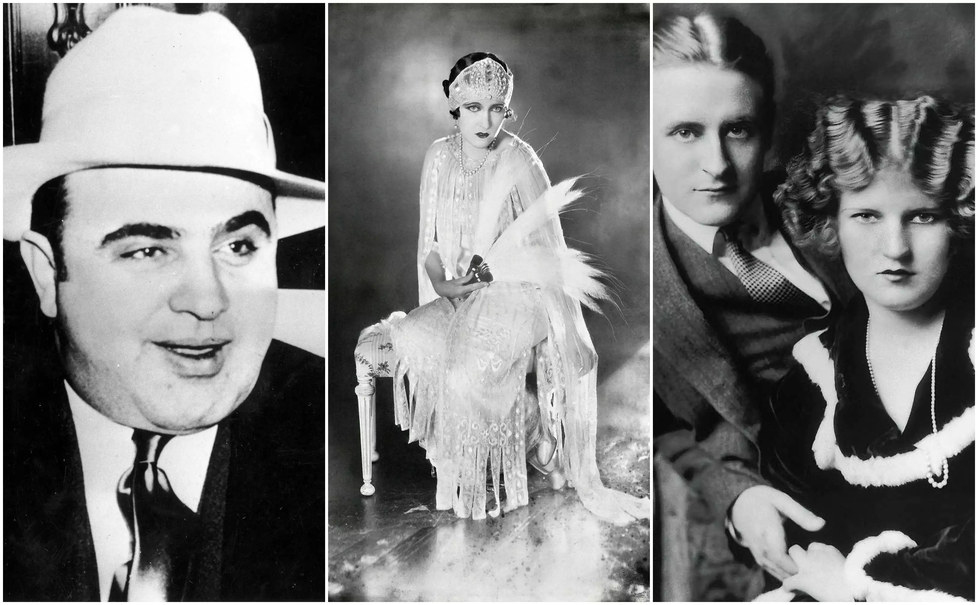
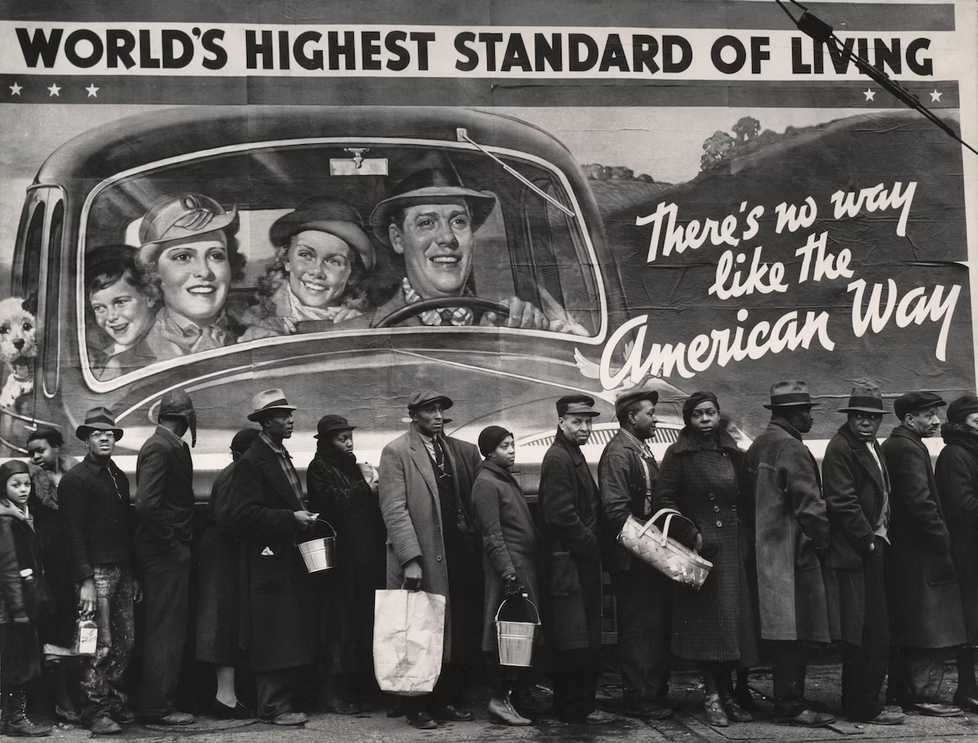
Warm Up: What do you notice about this primary source photograph taken during the Great Depression? Circle or star any key details you see in the "show your work" box.

Obavezno
1
Pitanje 2
2.

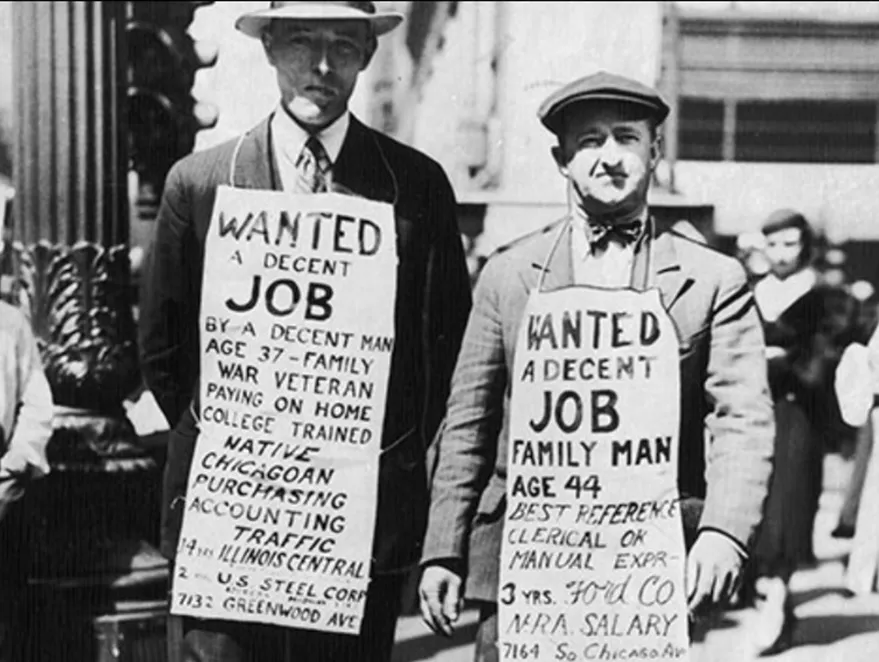
What do you think these people are standing in line for?

Obavezno
1
Pitanje 3
3.

In what ways is this image hypocritical? If you forget what "hypocritical" means, take a brief moment to look it up on Google now!

Before we learn about the Great Depression, let's compare it to the economy during the 2020 Coronavirus Pandemic.

Obavezno
1
Pitanje 4
4.

Which year did our country experience the highest unemployment rate ever?

Obavezno
1
Obavezno
1
Obavezno
1
Pitanje 7
7.

What is this graph measuring?

Obavezno
1
Obavezno
1
Pitanje 9
9.

Do you work at a job currently? If so, where do you work? Which category measured in the graph does your job fall under?

Obavezno
1
Pitanje 10
10.
Obavezno
1
Pitanje 11
11.
Obavezno
1
Pitanje 12
12.

Look at the men from Illinois pictured to the left. Notice how one man is a "Native Chicagoan." How do you think these men felt during this time period? What do you think was going through their minds when this photograph was taken?

The graph to the left shows the price of stocks during each year.

-Higher the line=higher the price of each stock = more money for companies/economy

-Lower the line=cheaper the price of each stock=less money for companies/economy

Obavezno
1
Pitanje 13
13.

In the graph, which range of years displays a decrease in Common Stock Prices?

SQN.01
Obavezno
1
Pitanje 14
14.

Which economic crash was worse?

SQN.01
Obavezno
1
Pitanje 16
16.

Exit Ticket: What is one similarity between the economic conditions during the Great Depression and the Coronavirus Pandemic?

Pitanje 5
5.

What percentage of Americans were unemployed in April of 2020?

Pitanje 6
6.

Why did the economy struggle so much during 2020? If you are unsure, take a guess!

Pitanje 8
8.

Which type of retail stores suffered the most at the start of the pandemic?

Pitanje 15
15.

Which type of economic crash is more severe?