2
There were a total of
2
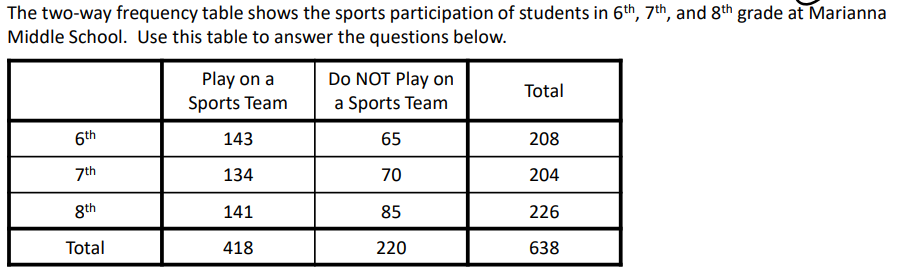
The number of 8th graders surveyed that play on a sports team is
2
There were
2
There were a total of
The number of 8th graders surveyed that play on a sports team is
There were
Fill in the correct answer for the table.
Complete the table.
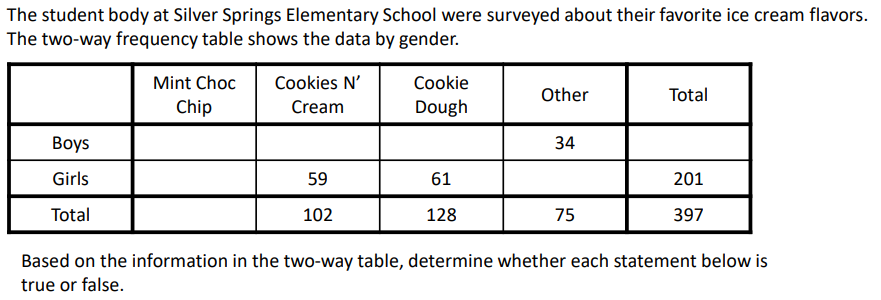
Determine whether each statement is true or false.
A total of 92 students prefer mint chocolate chip ice cream.
67 boys prefer Cookies N' Cream.
There were 196 boys included in the survey.
Approximately 20% of girls surveyed said they preferred mint chocolate chip ice cream.
52% of the boys surveyed prefer mint chocolate chip ice cream.
True
False
Complete the following table.
How many boys participated in the survey?
How many girls prefer papaya?
How many more girls than boys took the survey?
Change the two-way table from question 7 to a relative frequency table.
What percent of boys took the survey?
Do boys and girls prefer papaya or mango?
Do girls prefer papaya or mango?
Sanjay collected the following data from a survey on vegetables. To find the conditional relative frequency of those who like broccoli, given they also like asparagus, he divided 0.32 by 0.42. Will this result in the correct conditional relative frequency? Explain.

