Data Analysis - Quiz 2
star
star
star
star
star
Last updated almost 2 years ago
15 Nsɛmmisa
Level 2
Level 3
3

3

Level 4
Untitled Section
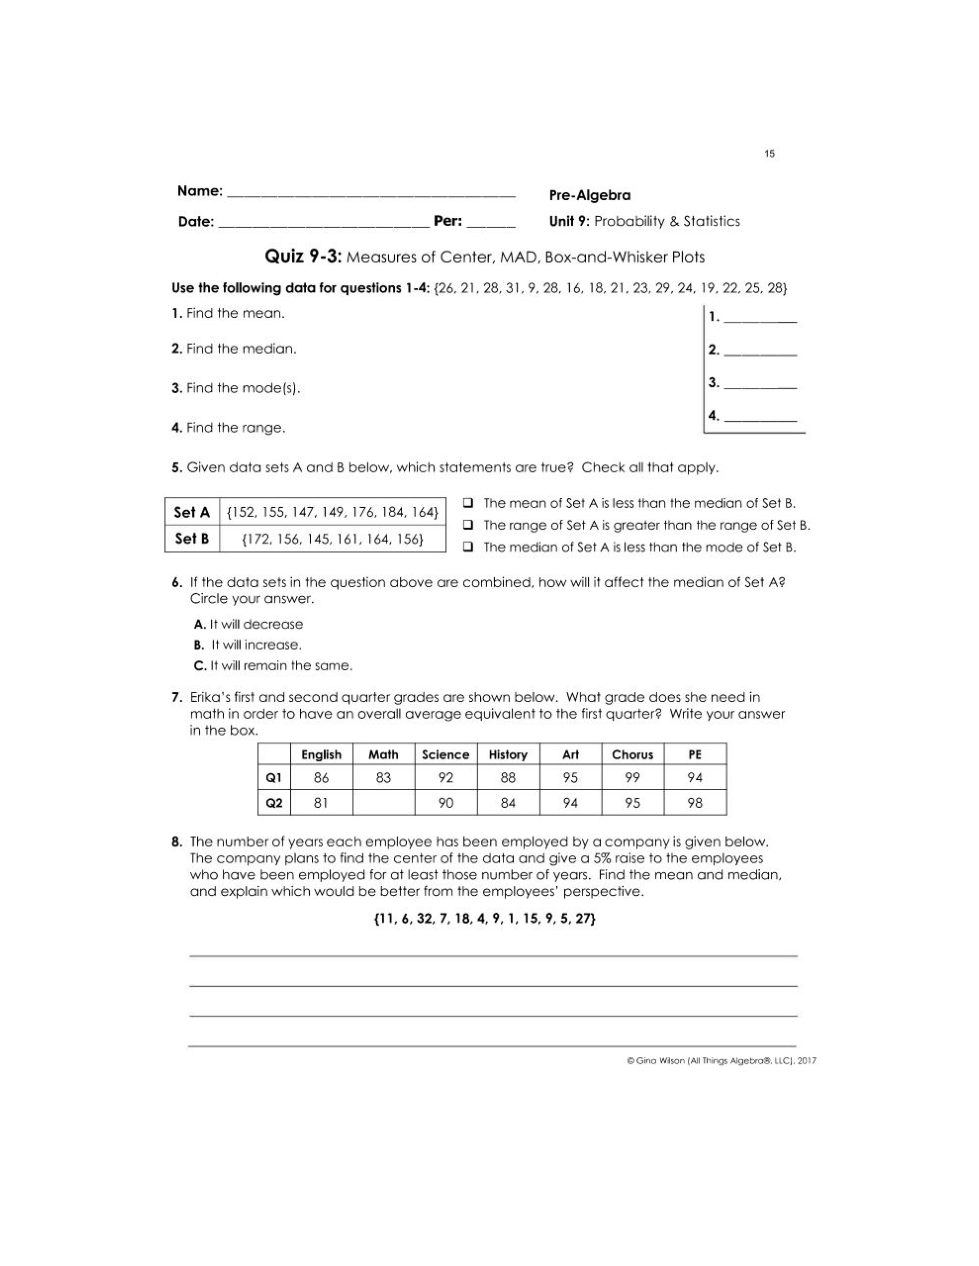
Find the mean.
(level 2)
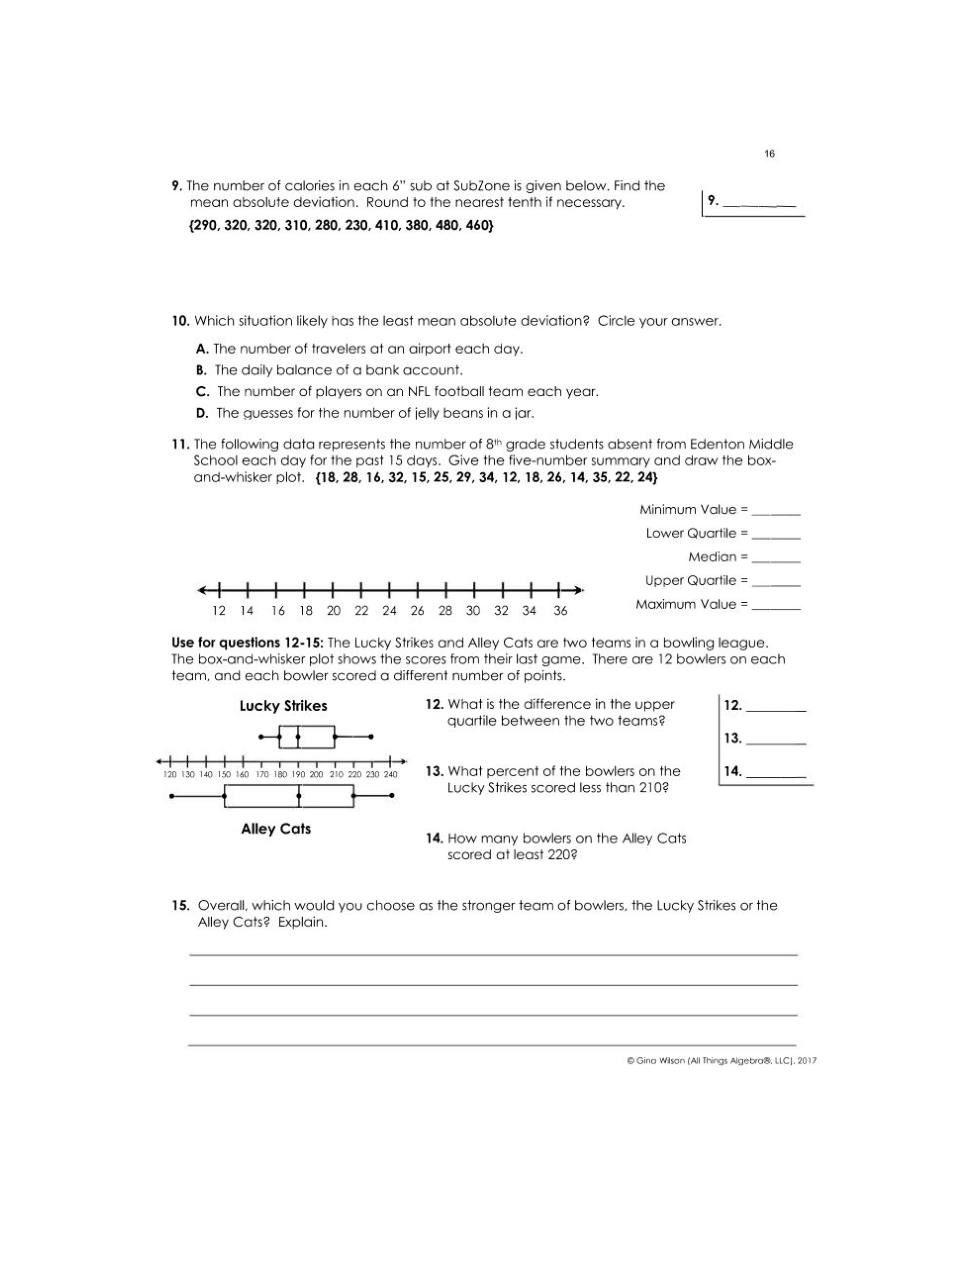
The number of calories in each 6" sub at Subzone is given below. Find the mean absolute deviation. Round to the nearest tenth if necessary.
{290, 320, 320, 310, 280, 230, 410, 380, 480, 460}
Which situation likely has the least mean absolute deviation? Explain.
a. The number of travelers at an airport each day.
b. The daily balance of a bank account.
c. The number of players on an NFL team each year.
d. The guesses for the number of jelly beans in a jar.
The following data represents the number of 8th grade students absent from Edenton Middle School each day for the past 15 days. Give the five-number summary and draw the box-and-whisker plot.
{18, 28, 16, 32, 15, 25, 29, 34, 12, 18, 26, 14, 35, 22, 24}
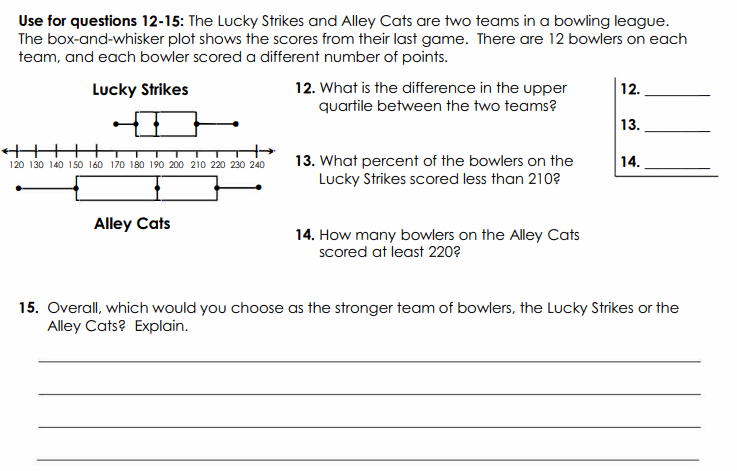
What is the difference in the upper quartile between the two teams?
What percent of the bowlers on the Lucky Strikes scored less than 210?
Overall, which would you choose as the stronger team of bowlers, the Lucky Strikes or the Alley Cats? Explain.
Find the median.
Find the mode(s).
Find the range.
Given data sets A and B (to the left), which statements are true? Check all that apply.
If the data sets in the question above are combined, how will it affect the median of set A?
How many bowlers on the Alley Cats scored at least 220?