[AP Statistics] 12.3 Inference for Slope
star
star
star
star
star
Last updated about 1 year ago
30 Nsɛmmisa

1
1
1
1
1
1
1
1
1
1
1
1
1
1
1

1


1
1
1
1
1
1
1
1
1
1
1
1
1
1
In this case, which variable is the explanatory and which is the response? How do you know?
Find Japan and Germany in the scatter plot below
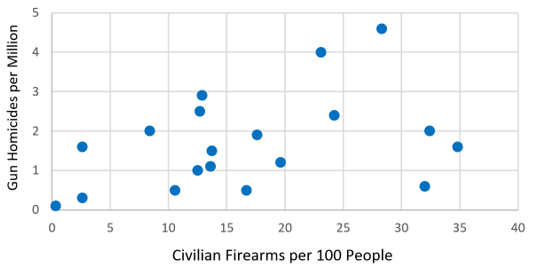
Look at Japan and Germany above. Comment on how their locations in these graphs relate to the “gun control” vs. “gun rights” arguments
Comment on the overall direction and strength of the relationship:
Using the regression output above, write down the equation of the Least Squares Regression Line
Interpret the estimate for the slope
What is the standard error for the slope? (you can find it in the regression output above)
Round to 3 places
We can use the standard error to find the 95% confidence interval for the true value of b, the slope.
b = sample slope
SEb=Standard Error of b
t* => Use a table/calculator
Degrees of freedom for a linear regression = n-2
95% CI for b
(
Round to 2 places
What slope value would indicate that there is no relationship between these two variables?
Is there convincing evidence of a linear relationship between rates of gun ownership and rates of gun homicide in developed nations?
Explain
We can also conduct a t-test about b, the true value of the slope
What is our null and alternative hypothesis about the true value of the slope of the regression in general terms?
The regression output above also gives the t test statistic and the p-value
What would be the conclusion of our test?
Answer this question using only the data we’ve analyzed, without making any assumptions.
You can use Stat->Test->LinRegTTest and LinRegTInt in your calculator to perform the do step. Put your data in L1 and L2 and leave RegEQ blank (or put Y1 in if you want it to put the regression equation in y1 for you afterwards)
STATE
PLAN - Assumed to meet conditions
DO -
CONCLUDE
STATE
PLAN
DO
CONCLUDE


