Surfing Wave
star
star
star
star
star
Last updated about 3 years ago
4 Nsɛmmisa
Analyze and interpret data to identify a pattern in the characteristics of an ocean wave (wavelength, frequency, and amplitude). MS-PS4-1
Analyze and interpret data to identify a pattern in the characteristics of an ocean wave (wavelength, frequency, and amplitude). MS-PS4-1
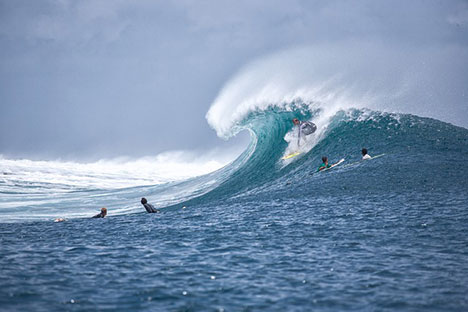
Surfing Wave
David and Laura love to go surfing together. They saw that the water waves in the ocean did not seem to come very often (the average frequency, or waves per second). When the water wave came, the height of the wave (amplitude of the wave) was high.
They want to know more about the pattern of water waves for surfing. So they looked out to sea at the ocean and collected data about the wave crests (the highest point of the wave) and troughs (the lowest point of the wave) of the oncoming waves (see Table 1) and generated a graph (see Figure 1). As they waited for the waves to arrive they recorded how the height of the water changed over time (see Table 2).
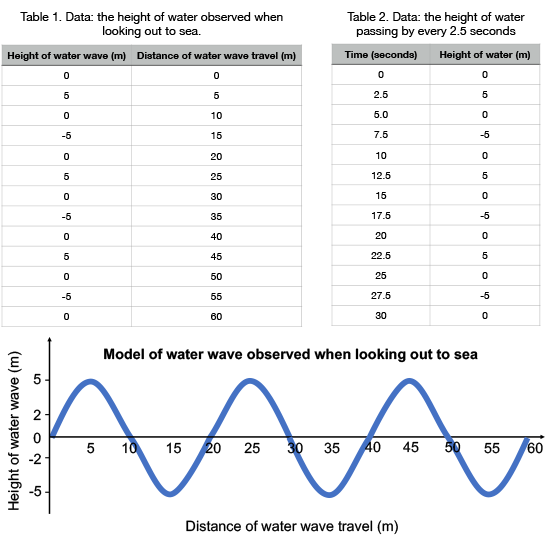
Using the table and graph, summarize the trends of the data during every 10 second interval (e.g., 0-10, 10-20, and 20-30 seconds).
Using the patterns in the data and graph, what is the amplitude of the waves? Describe or illustrate the pattern you used to figure this out.
Using the patterns in the data and graph, what is the wavelength of the waves? Describe or illustrate the pattern you used to figure this out.
Using the patterns in the data and graph, what is the frequency of the waves per 10 seconds? Describe or illustrate the pattern you used to figure this out.