Log in
Sign up for FREE
arrow_back
Library

Teacher Paced - One the Rise

star
star
star
star
star
Last updated over 1 year ago
9 questions
1
1
1
1
Question 1
1.

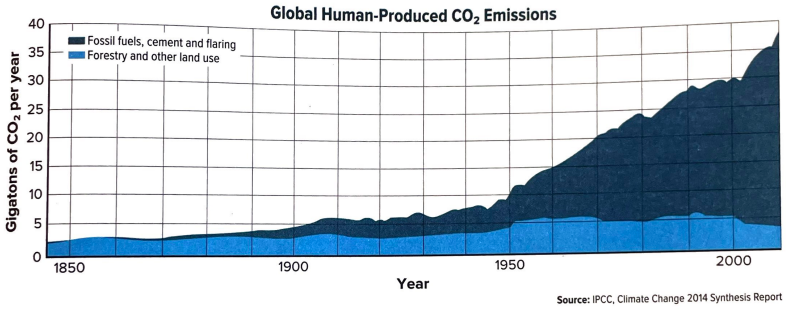
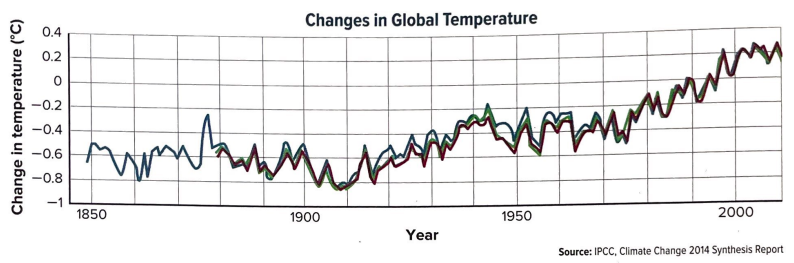
A) How would you describe the data prior to 1950?
B) How would you describe the trend in atmospheric CO2 from 1950 to now?

Question 2
2.

Question 3
3.

1
1
Question 5
5.

What pattern do you see in the data before 1950?

1
1
Question 8
8.


Would you consider the relationships as causal (an observed event or action appears to have caused a second event or action) or correlational (variables increase or decrease in parallel, however one might not have caused the other)? Explain.

Sentence starter:
I believe the relationship is __________. From the data we can see... This proves that this is ___________ because...

Human Impact


Are humans affecting the climate? According to 97 % of actively publishing climate scientists - yes. In fact, according to the National Oceanic and Atmospheric Association (NOAA), over the last five decades natural factors would actually have led to a slight cooling of global temperatures.

In 2014, the Intergovernmental Panel on Climate Change (IPCC) concluded that the increase in CO2 and other greenhouse gases and resulting climate change is extremely likely due to human activities. As you discovered, the main source of atmospheric carbon dioxide from humans is from the burning of fossil fuels. Deforestation and other land use is the second largest contributor of human-produced atmospheric CO2.
3
Based on the title, this is a graph of...
naturally-produced CO2 emissions
human-produced CO2 emissions
Which human activity produces more gigatons of CO2 per year?
CO2 emissions from forestry and other land use
CO2 emissions from fossil fuels from cement and flaring
Question 4
4.

Question 6
6.

What pattern do you see occurring in data after 1950?

Question 7
7.

What was the approximate temperature anomaly in 1910 versus in 2010?

Question 9
9.

Using what you have learned so far in the lesson, explain the conditions under which Earth's climate system can change?

Based on the title,
what is this a graph of?
Changes in the Environmental Air Quality
Changes in the Amounts of CO2
Changes in Global Temperature
Changes in the Color of Water