Preskoči na glavni sadržaj
Prijava
Sign up for FREE
arrow_back
Biblioteka

2025 (Jun.): NY Regents - Earth and Space Sciences

star
star
star
star
star
Posljednje ažuriranje 4 months ago
59
Napomena autora:

NOTICE

A four-function or scientific calculator and a copy of the 2024 Edition Reference Tables for Earth and Space Sciences must be available for you to use while taking this examination. Note that diagrams are not drawn to scale unless otherwise noted.

Base your answers to questions 1 through 5 on the information below and on your knowledge of Earth and Space Sciences. Some questions may require the use of the 2024 Edition Reference Tables for Earth and Space Sciences.

Our Sun – A Star

The Hertzsprung-Russell (H-R) diagram was developed from star charts by two scientists in different countries independently of each other in 1911. It classifi ed stars based on their surface temperatures, observable color, and magnitude. Absolute magnitude is a measurement of how bright a star would appear if all stars are the same distance from Earth. The brighter the star, the lower the absolute magnitude value.

The model below shows the layers of the Sun and information about some features of each layer.

The model below represents the orbits of celestial bodies around our Sun. The inset model shows some information about the region of the solar system inside the orbit of Jupiter.

An observer on Earth sees phases of the Moon, but the Moon isn’t the only solar system body to exhibit phases. Venus also has observable phases as viewed from Earth. Venus’s orbit around the Sun is approximately 225 Earth days.

The photograph below shows a Moon phase and Venus viewed with unaided eyes in the night sky. The inset box shows Venus observed using a telescope. Both the Moon and Venus are in crescent phase.

1
Pitanje 1
1.
HS.ESS1.1
1
HS.ESS1.1
1
HS.ESS1.4
1
HS.ESS1.4
0.33
HS.ESS1.7
1
HS.ESS2.4
1
HS.ESS2.4
1
HS.ESS3.5
1
HS.ESS2.2
1
Pitanje 10
10.
HS.ESS3.5

Base your answers to questions 11 through 15 on the information below and on your knowledge of Earth and Space Sciences. Some questions may require the use of the 2024 Edition Reference Tables for Earth and Space Sciences.

The Carbon Cycle

The global carbon cycle refers to the movement of the element carbon through different storage places, or reservoirs, on Earth. Carbon moves through these reservoirs at different rates. Most carbon near Earth’s surface cycles fairly quickly. Carbon in the atmosphere recycles in about three to five years, while plants recycle carbon in about 50 years. The carbon found in soil and fossil reservoirs is recycled, on average, in about 3000 to 5000 years.

The carbon cycle has two parts. The “fast cycle” involves the biological processes of photosynthesis and decomposition. The “slow cycle” involves the time it takes for soil (inorganic) carbon to form from the weathering of rocks and soil.

Wildfire events contribute to the carbon cycle. In 2020, megafires released an estimated 107 million metric tons of carbon dioxide into the atmosphere – equivalent to the amount released by about 23 million cars.

The model below shows some information about Earth’s systems and the carbon cycle.

Model of Effects of Forest Fires and Burning Fossil Fuels on the Carbon Cycle

Diagram showing atmosphere, natural CO2 from burning forest biomass carbon, CO2 cycling to a living forest, and human induced CO2 released from carbon stored in fossil fuels.

The model below represents how carbon levels change depending on what is happening with the trees in a forest.

Forest Carbon

The model below shows the movement of carbon (arrows) through the four Earth spheres. The numbers indicate the amount of carbon naturally added or removed from the spheres in gigatons (GT) per year. The numbers in bold indicate the amount of carbon added or removed by human activity. Numbers in parentheses ( ) are amounts of stored carbon.

Models of Fast Carbon Cycle

In Earth’s past, the carbon cycle has changed due to changes in climate that resulted from several different factors. Changes in the Sun’s energy, the amount of marine organisms that remove carbon dioxide from the atmosphere, and uplift of major mountain chains have all contributed to variations in CO2.

Ice-core data provides a record of atmospheric carbon dioxide (measured from air trapped in the ice in parts per million (ppm)) and of Antarctic surface temperature changes over the last 800,000 years, as shown in the graphs below.

1
Pitanje 11
11.

Explain the process that the trees in a forest use to make energy for food and describe how this process is responsible for a decrease in atmospheric carbon dioxide levels.

HS.ESS2.2
1
HS.ESS2.6
1
HS.ESS3.1
1
HS.ESS2.2
1
Pitanje 16
16.

Identify the factor that determines the lifespan of the Sun and other stars.

HS.ESS1.1
1
HS.ESS1.3
1
HS.ESS1.1
1
HS.ESS1.2
1
HS.ESS1.2
1
Pitanje 21
21.

Describe how heavy rain events along the Hudson River would affect the location of the salt front.

HS.ESS2.5
1
HS.ESS2.2
1
HS.ESS3.1
1
HS.ESS3.4
1
Pitanje 25
25.

Explain how the graph supports the claim that dredging of the Hudson River has only been partially effective at reducing PCB levels in fish, compared to EPA targets.

HS.ESS2.2

Base your answers to questions 26 through 30 on the information below and on your knowledge of Earth and Space Sciences. Some questions may require the use of the 2024 Edition Reference Tables for Earth and Space Sciences.

The Origin of Our Solar System

The Sun and eight planets in the Solar System formed at the same time. Evidence of their formation can be found throughout the Solar System. Scientists have used data from planets, meteorites, and Earth to determine how the Solar System formed and its early history. The data table below lists some information for the eight planets.

Solar System Data table with types of planets, their names, and number of moons

Meteorites on Earth have been helpful in reconstructing the history of our solar system and our planet. Samples taken from meteorites have been age dated using absolute dating techniques that measure the amount of Uranium-238 compared to the amount of its decay product in samples found on Earth. The graph below shows some information about Uranium-238.

Throughout Earth’s history, meteorites have created impact craters on continental and ocean crust surfaces. However, of the approximately 200 craters confirmed on Earth’s surface, only about 20 are located within ocean crust. This is surprising since approximately 70% of Earth’s surface is covered in water. It is suggested by scientists that the movement of Earth’s plates may play a role in the lack of evidence of impact craters observed on ocean crust.

The approximate rates of movement of oceanic and continental crust are indicated on the model in cm/yr. Two impact craters are labeled.

Earth’s systems do not operate independently. For instance, changes in the ocean’s temperature can influence atmospheric temperatures. A similar coevolutionary process occurred in Earth’s early history when oxygen levels were transitioning from Earth’s ocean to the atmosphere.

The model below shows some information about Earth’s ocean and atmosphere.

1
HS.ESS1.6
1
HS.ESS1.4
1
Pitanje 28
28.

A sample of a meteorite was tested and found to contain 50% Uranium-238. Use evidence from the graph to make a claim about how the radiometric dating of meteorites can be used to construct an account about when Earth formed.

HS.ESS1.6
1
HS.ESS2.1

Base your answers to questions 31 through 35 on the information below and on your knowledge of Earth and Space Sciences. Some questions may require the use of the 2024 Edition Reference Tables for Earth and Space Sciences.

Mining and Use of Lithium

Lithium is a highly reactive alkali metal that is used in the manufacturing of lubricants, pharmaceuticals, glass, and rechargeable batteries. The demand for lithium has grown because lithium is often used in modern electronics like phones, laptops, and electric cars. When in operation, a battery electric vehicle produces zero tailpipe emissions.

The infographic below summarizes the average amount of emissions, measured in tons of carbon dioxide (tCO2e) associated with the manufacturing and use of three different types of vehicles during their lifetime.

The data table below summarizes originally proposed toll rates for motorists entering New York City by Port Authority bridges and tunnels from New Jersey. Vehicles eligible for the Green Pass Discount include plug-in hybrid electric vehicles and battery electric vehicles.

Lithium is currently sourced from surface mines or underground brine reservoirs. Lithium ore extracted from open pit mines is dried in fossil fuel burning kilns. The underground reservoir brine method uses evaporating ponds and solar energy to collect lithium from brine water having a high concentration of various salts. The table below shows some information related to these two mining methods.

Lithium production has impacts on land use in the Atacama region of Chile. The photograph shows solar evaporation ponds at a brine extraction and processing facility.

Aerial photograph labeled Brine Extraction Facility showing many rectangular solar evaporation ponds at a lithium brine extraction and processing site.

The graph below shows some information about lithium.

The Andean flamingo, a bird native to wetlands in the Atacama region of Chile and other locations where lithium deposits occur, is listed as a vulnerable species. The model below shows some information about the reservoir brine method. The graph shows projected changes from 2020 to 2060 in Atacama wetland areas due to lithium mining.

1
HS.ESS3.2
1
HS.ESS3.6
1
HS.ESS3.3

Base your answers to questions 36 through 40 on the information below and on your knowledge of Earth and Space Sciences. Some questions may require the use of the 2024 Edition Reference Tables for Earth and Space Sciences.

Ghost Forests

“Ghost forest” is a term used to describe a group of dead trees or tree stumps that remain standing. Ghost forests often form due to environmental change or natural disasters that impact coastal forests. As sea level changes, the invading seawater can advance and overtake the fresh water that many tree species in coastal forests need to exist. This salty water slowly poisons living trees, leaving dead and dying timber. Ghost forests can be found in almost every coastal state in the United States.

Coastal forests serve as efficient carbon sinks, collecting and storing atmospheric carbon. They are critical for maintaining water quality as they naturally filter, cool, and slow the movement of groundwater and streams. Coastal forests protect against erosion, buffer storm surges, provide wildlife habitats, and ensure water quality and quantity. As saltwater intrusion intensifies, the supply of coastal wood needed by the timber industry will also shrink, harming the economy of rural areas that depend on it.

The graphs below show some information about global temperature, CO2, and sea level. An anomaly is a change from an expected value. An anomaly value of 0 represents no change from the historical average.

Coastal ghost forest with many tall dead trees standing.The infographic below shows the predicted development of a ghost forest in a coastal area near a residence from the year 2020 to 2100. Brackish water is a mix of fresh and salty water.

The model below shows the effects of subsidence in the creation of ghost forests as a result of an earthquake that occurred on January 26, 1700, along the west coast of the United States.

Six proposed solutions for reducing the expansion of ghost forests are below.

Proposed Solutions

  1. Fortify seawalls with concrete

  2. Use sand and soil to create dunes with grasses along the coast

  3. Limit development along coastal wetlands

  4. Install sand fencing to reduce loss of sand from wind erosion

  5. Preserve and restore the biodiversity of vegetation in tidal areas

  6. Install tall rock walls and other artificial breakwaters

1
HS.ESS2.2
1
HS.ESS3.5
1
HS.ETS1.3

Base your answers to questions 41 through 45 on the information below and on your knowledge of Earth and Space Sciences. Some questions may require the use of the 2024 Edition Reference Tables for Earth and Space Sciences.

Human Impact on Earth

Global human population has increased dramatically in the last 50 years, which has increasingly stressed Earth’s natural resources. This has created challenges in the management of those natural resources while also creating opportunities to find solutions to those challenges.

The EN-ROADS simulator is an online tool that allows users to manipulate variables in order to see their effects on climate change. A student used this simulator to estimate the global temperature change by the year 2100 if no changes to current conditions were made and if changes from current conditions were made.

The graphs show the results of the simulations. Simulation 1 shows the possible outcome of greenhouse gas net emissions and the associated atmospheric global temperature change under current conditions. Simulation 2 shows the possible outcome of greenhouse gas net emissions and the associated atmospheric global temperature change due to a different set of computer input conditions.

The graphs below show some information about different types of fossil fuels.

The table below shows some information about arable land from 1961 to 2016. Arable land is land that can be used for growing crops and supporting livestock.

The Cheetah Conservation Fund (CCF) is a non-profit organization that is working to ensure the survival of the cheetah and its habitat in Namibia, Africa. The central part of this African country was once a mixed woodland savannah. However, overgrazing by livestock (cattle raised for meat), hunting of elephants and rhinos, and removal of mature trees has changed the landscape to be dominated by thornbushes. This restricts the ability of animals in this habitat to hunt. CCF harvests these thornbushes to make Bushblok, a miniature log which can be used as a biomass fuel source.

1
HS.ESS3.3
1
HS.ESS3.3
1
HS.ESS2.2
1
HS.ETS1.2

Base your answers to questions 46 through 50 on the information below and on your knowledge of Earth and Space Sciences. Some questions may require the use of the 2024 Edition Reference Tables for Earth and Space Sciences.

Tectonics of the Hawaiian Islands

The Hawaiian Islands are situated near the center of the Pacific Plate and are volcanic peaks representing a history of volcanic eruptions. The island of Hawaii is over a hotspot, where a magma source in the mantle pushes upward to Earth’s surface creating active volcanoes. The island of Hawaii itself is still being formed by ongoing volcanic activity at Mauna Loa and Kilauea volcanoes, both of which are currently situated over the hotspot. Loihi, an undersea volcano, also sits above the hotspot and will likely become the next Hawaiian island. The other islands in the chain are extinct volcanoes.

The maps show some information about the Hawaiian islands. Varying ages of bedrock on many of the islands are indicated in millions of years. The model shows three stages of island formation over a mantle hotspot.

The models below show the geologic history of the formation of present-day Maui.

The photographs below show some shoreline locations on the island of Maui. Human development along the shoreline has impacted coastal regions. Scientists designed solutions to reduce this impact.

1
HS.ESS2.1
1
HS.ESS1.5
1
HS.ESS2.1
Pitanje 2
2.

Based on the information in the model, which list of five of the Sun’s layers are in the correct sequence to allow energy generated by fusion to eventually reach the Sun’s surface as radiation?

Pitanje 3
3.

The table below shows the eccentricity of the orbits of Mercury and Venus around the Sun.

Planet

Eccentricity

Mercury

0.206

Venus

0.007

Select the two statements that are correctly predicted by Kepler's Laws.

Pitanje 4
4.

Based on the Our Solar System Model, if a new planet was identified that orbited the Sun at an average orbital distance greater than that of Mercury but less than that of Venus, the average speed of this planet would be

Pitanje 5
5.

Base your answers to questions 6 through 10 on the information below and on your knowledge of Earth and Space Sciences. Some questions may require the use of the 2024 Edition Reference Tables for Earth and Space Sciences.

Modeling Earth Systems to Understand Global Climate

The geologic record shows a long history of climate fluctuations as a result of many different factors. Climate scientists study models of Earth’s motions, ocean currents, plate tectonic movement, and atmospheric composition to better understand energy flow into and out of Earth’s systems.

Obliquity, the tilt of Earth’s axis relative to the Sun, has a direct impact on Earth’s climate. Earth’s obliquity changes on a cycle that takes place over a period of 41,000 years. The obliquity is currently decreasing and will reach its minimum value of $22.1^\circ$ in approximately 9800 years.

Maximum and Minimum Angles of Obliquity

Another factor climate scientists have identified that contributes to changes in energy flow in Earth systems is ocean current circulation.

The model, Diagram 1, and Diagram 2 show some information about circulation patterns in ocean currents. Points X and Y are locations on Earth’s surface.

Since the Industrial Revolution, deposition of dark particles such as dust, dirt, and rock in glacial ice (contaminated snow) have caused glaciers to darken. This has led to feedbacks that have caused changes to other Earth systems.

Percent of Sunlight Reflected and Absorbed by Different Glacial Surfaces

Yearly and Cumulative Ice Loss for 37 Glaciers

Computer-based global climate models are helpful tools for collecting data on projected future climate conditions. These models use various scenarios, or possibilities, that assume different human-based decisions on how we address greenhouse gas emissions.

The graph below shows future greenhouse gas concentrations for four different greenhouse gas emission scenarios measured in parts per million (ppm).

Projected Atmospheric Greenhouse Gas Concentrations

The graph below shows some information about global surface air temperature changes. These models are compared to the average global surface air temperature between the years 1986 to 2005, indicated as 0.0$\degree$ C.

Global Surface Air Temperature Change for Four Greenhouse Gas Emission Scenarios

Pitanje 6
6.

During winter, which statement best describes the amount of energy Earth’s northern hemisphere will receive and the impact on global ice formation when the obliquity is 22.1°, compared to Earth’s present obliquity?

Pitanje 7
7.

Which statement most accurately describes the influence of melting glaciers at X on the strength of Earth’s ocean currents?

Pitanje 8
8.

Which statement most accurately describes the influence of present surface ocean currents on the climate at location Y?

Pitanje 9
9.

Which model correctly represents the feedbacks that occur when dark surfaces are exposed in glacial areas and cause changes to one or more Earth systems?

Pitanje 12
12.

Which statement correctly identifies the quantitative cycling of carbon between two of Earth’s spheres as a result of natural processes and human activities?

Pitanje 13
13.

Which explanation describes how climate change from increased atmospheric carbon dioxide has influenced human activity?

Pitanje 14
14.

Which claim correctly summarizes the data in the graphs that a change to one Earth system caused a change to another Earth system?

0.5
Pitanje 15a
15a.
HS.ESS3.5
0.5
Pitanje 15b
15b.

Associated impact:

HS.ESS3.5

Base your answers to questions 16 through 20 on the information below and on your knowledge of Earth and Space Sciences. Some questions may require the use of the 2024 Edition Reference Tables for Earth and Space Sciences.

Stars and the Big Bang

Our Sun is a 4.6 billion-year-old yellow dwarf star. It was formed either from matter produced during the Big Bang or from matter released when large stars reached supernova and exploded. This matter, in the form of hydrogen, contracted into a denser gas cloud due to gravity. The temperature at this cloud’s core increased, allowing for the fusion of two hydrogen nuclei into one helium nucleus. The mass of this helium nucleus is slightly less than the mass of the hydrogen nuclei. This difference in mass is the source of the star’s energy.

The model below shows some information about the life cycles of different stars.

Model of Life cycles of Different Stars

Model of life cycles of different stars, showing the sequences for high-mass stars (massive blue stars), medium-mass stars (like our Sun), and low-mass stars (red dwarfs), from gas and dust cloud through various stages such as main sequence, red giant, supergiant, supernova, planetary nebula, white dwarf, neutron star, black hole, and red dwarf, with timescales of millions, billions, and trillions of years.
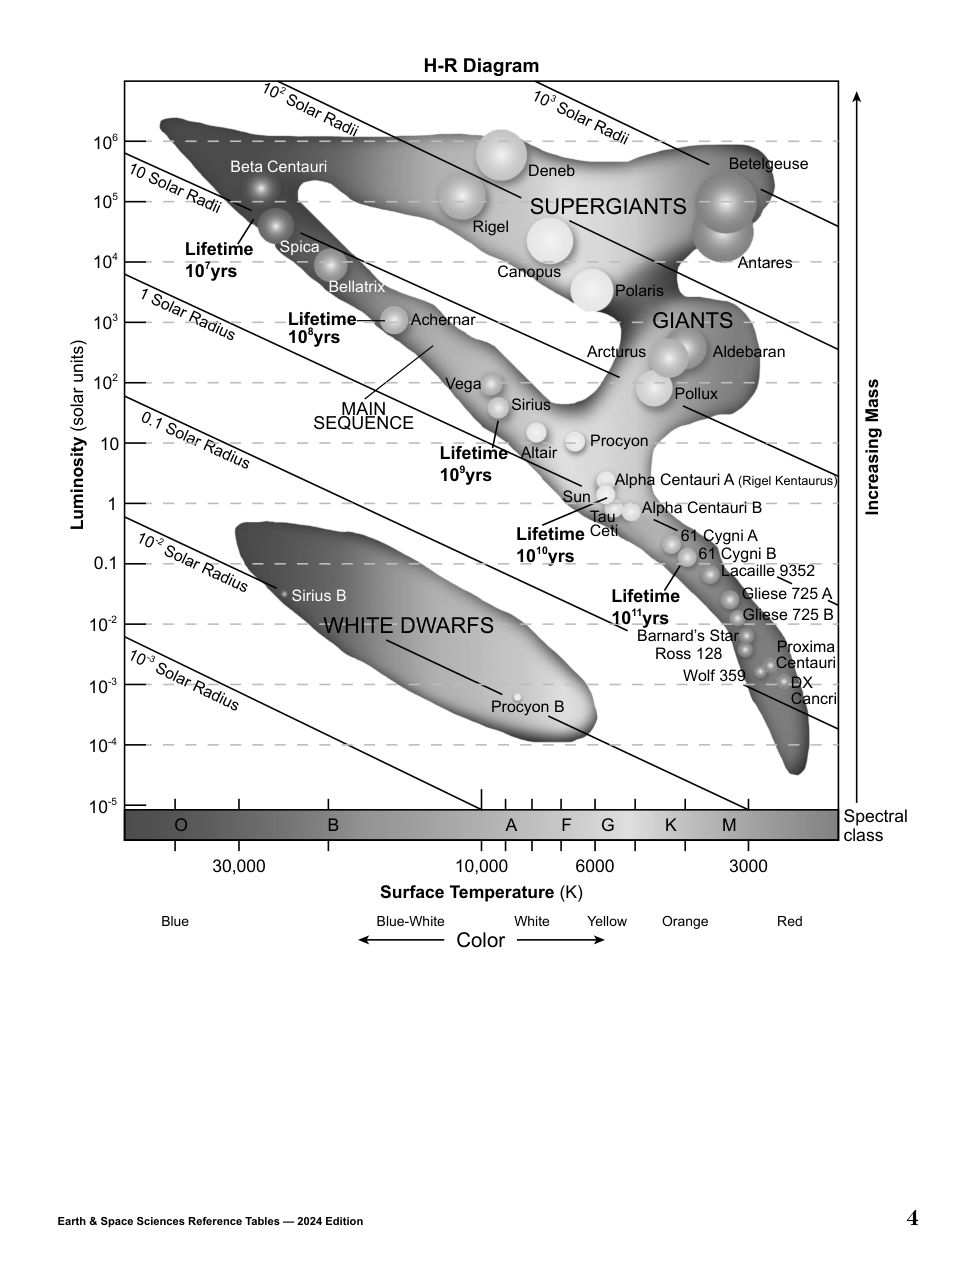
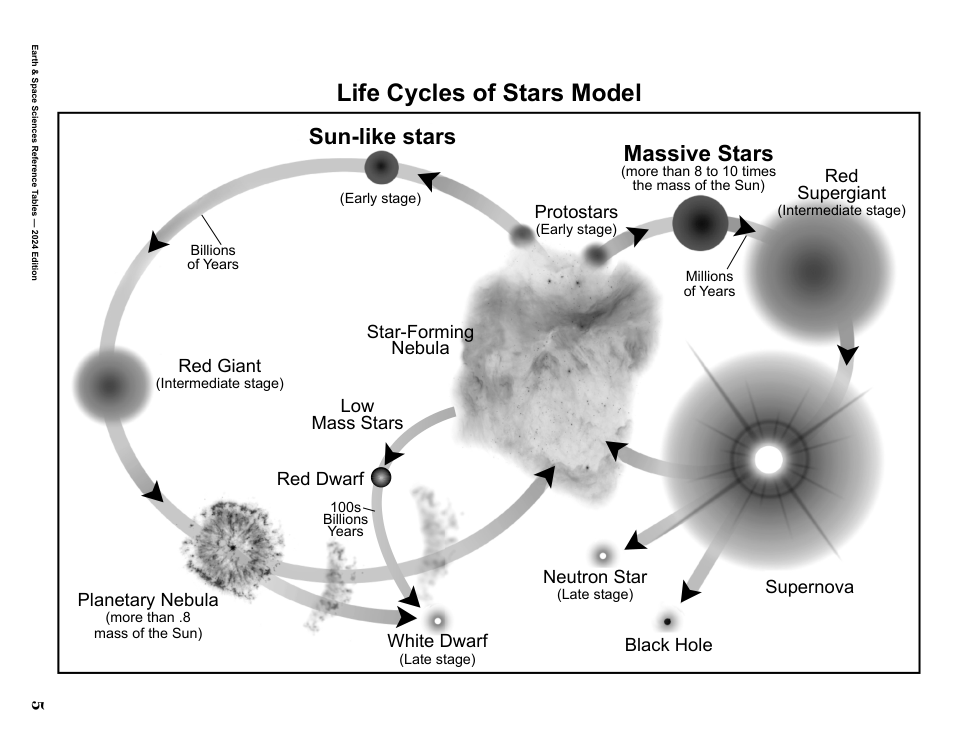
The table below shows some information about different types of stars. Solar mass is the mass of the star compared to the Sun.

Star

Solar Mass

Distance from Sun (light years)

Approximate Lifespan (yr)

Spica

10.3

260.9

less than 30 million

Betelgeuse

16.5

548

10 million

Sun

1.0

0

9 billion

Aldebaran

1.16

65

6.4 billion

Sirius B

0.98

8.6

0.23 billion

Wolf 359

0.09

7.86

4.1 trillion

Sunspots are areas where the magnetic field is about 2500 times stronger than Earth’s magnetic field. Because of this strong magnetic field, the magnetic pressure increases and the Sun’s surrounding atmospheric pressure decreases. This lowers the temperature relative to surrounding areas because it inhibits the flow of new super-hot gas (plasma) to the surface.

Sunspots occur in pairs because they have magnetic fields pointing in opposite directions. However, from 1645 to 1715 there was nearly zero sunspot activity. This time period is referred to as the Maunder Minimum. Some scientists also called this time period on Earth “The Little Ice Age”.

The graph below shows some information about sunspot frequency.

In the 1920s, Edwin Hubble studied the motion of galaxies. He found a relationship between a galaxy’s velocity as measured from Earth (recessional velocity) and the galaxy’s distance from Earth. This relationship is known as Hubble’s Law. This law has implications for understanding how the universe has changed since the Big Bang.

The graph below shows data on several galaxies’ distances from Earth in megaparsecs (Mpc) and their recessional velocities.

Particles were created as a result of the Big Bang. The first particles were subatomic particles like the protons, neutrons, and nuclei of lighter elements such as hydrogen, helium, lithium, and beryllium. The graph below shows some information about these particles, the temperature of the universe at the time they were created, and the amount of time after the Big Bang that they were created.

Pitanje 17
17.

A student created a data table containing information on how stars synthesize common elements through nucleosynthesis. Which row of data correctly identifies all the characteristics for that star?

Pitanje 18
18.

Using information from the passage and the graph, place a check mark (✓) in three boxes to identify the statements that accurately describe sunspots.

Pitanje 19
19.

The Relationship Between Galaxy’s Distance from Earth and Recessional Velocity graph shows that the recessional velocity of a galaxy __A__ as the galaxy’s distance from Earth increases. This is evidence for the __B__ of the universe and suggests that the universe initially was __C__ at the time of the Big Bang. As a result, this data suggests that the universe is changing at __D__ rate.

Which table below correctly identifies the missing words and phrases labeled A, B, C, and D in the passage above?

Pitanje 20
20.

Based on information from the Relationship Between Relative Amount of Different Particles and Temperature of the Universe After the Big Bang Over Time graph, which table correctly identifies the composition of matter in the universe as evidence for the Big Bang theory?

Base your answers to questions 21 through 25 on the information below and on your knowledge of Earth and Space Sciences. Some questions may require the use of the 2024 Edition Reference Tables for Earth and Space Sciences.

New York State’s Hudson River

New York State’s Hudson River watershed covers almost 1340 square miles and includes three different watersheds: Mohawk River, Hudson River Estuary, and Upper Hudson River watersheds. The Hudson River flows south for almost 325 miles from the Adirondacks to New York City. The 153-mile-section from Troy to New York Harbor in New York City is a tidal estuary. Here, fresh water flowing south down the river meets salt water pushing in from the Atlantic Ocean. The leading edge of sea water entering the estuary is called the salt front. The salt front moves with the tides, the weather, and the seasons. When there is heavy rain, more fresh water flows into the Hudson River. Cities and towns that take their drinking water from the Hudson River carefully track the salt front as it affects the quality of drinking water.

Map of Hudson River Watersheds in New York State showing Upper Hudson River, Hudson River Estuary, and Mohawk River watersheds and locations of various cities along the river.

The location of the salt front is measured in HRM (Hudson River Mile) units. Hudson River Mile 0 is at the southern tip of Manhattan in New York City.

The tables below show some information about the salinity along the Hudson River for several locations north of New York City on two different dates. Salinity is measured in milligrams of chloride per liter of water (mg/L), and the salt front is located where salinity is 100 mg/L.

An advancing salt front along the Hudson River can affect the quality of drinking water for communities such as Poughkeepsie, which use fresh water from the river as a source of drinking water. For this reason, two different environmental groups carefully monitor the salt front in the river.

Since over 10 million people in New York State rely on the Hudson River for clean drinking water, both environmental groups have developed a plan to evaluate salt front advancement and to prevent the salt from entering the drinking water intakes.

This $400,000 plan has a budget to monitor and evaluate salt front advancement over the next 35 years. This budget has two components summarized below:

  • Allocate $250,000 to predict salt front location from 2025–2075 using stream and river flow data.

  • Allocate $150,000 to develop a proactive action plan to maintain safe drinking water for several water treatment plants.

The location of the salt front and its effect on drinking water quality is not the only issue facing residents along the Hudson River.

Between 1947 and 1977, industries that manufactured substances used in fire prevention and oil insulators, called PCBs (polychlorinated biphenyls), were found to be toxic to humans and life in the river. By then, the industry, located north of Albany, had dumped an estimated 1.3 million pounds of PCBs into the river. Once in the river, the chemicals mixed with sediments on the river bottom and along the shorelines. The removal of a dam in the upper Hudson in 1973 further released large amounts of contaminated sediments.

In 1984, the Environmental Protection Agency (EPA) classified a 200-mile stretch of the river as a federal Superfund site that required the removal of the PCBs from the river sediment. A 40-mile stretch north of Albany was termed as a “hot spot” where PCB contaminated sediment was removed by dredging between 2009 and 2015. The model below shows some information on PCBs in the Hudson River.

Eating contaminated fish is the single greatest human exposure to PCBs. The PCBs in the upper Hudson River have been present for 70 years and have accumulated in fish.

The EPA issued an advisory to not eat fish taken from the upper Hudson River. In 2002, the EPA adopted targets of PCB concentrations in fish to be reached by 2020 and 2031. The graph below shows PCB concentrations of fish taken from the upper Hudson River and these targets.

Pitanje 22
22.

A student makes a claim that the location of the salt front is constantly changing due to weather conditions. Which table below supports the student’s claim by correctly identifying the two locations between which the salt front was located on October 6, 2004, and October 12, 2006?

Pitanje 23
23.

Based on evidence in the plan developed by the environmental groups, which explanation correctly describes how the availability of fresh water will influence communities along the Hudson River?

Pitanje 24
24.

Based on the model and graph, which would be the next logical solution that would cause the greatest decrease in PCB levels in fish in the Hudson River?

Pitanje 26
26.

Which statement best describes the differences between terrestrial planets and Jovian planets in the solar system as a result of the early history of their formation?

Pitanje 27
27.

Which value would be the most accurate prediction for the period of revolution for Saturn?

Pitanje 29
29.

Which statement most accurately identifies why evidence of impact crater A will most likely not be preserved for as long as impact crater B?

0.5
Pitanje 30a
30a.
HS.ESS2.7
0.5
Pitanje 30b
30b.

Argument with evidence:

HS.ESS2.7
0.5
Pitanje 31a
31a.
HS.ESS3.2
0.5
Pitanje 31b
31b.

Evidence:

HS.ESS3.2
0.5
Pitanje 32a
32a.

Vehicles entering New York City add pollutants to the air in a congested urban area. Describe the economic benefit to motorists who drive class 1 and class 7 vehicles during off-peak hours that qualify for the Green Pass toll rate. Also, discuss how the wants and needs of society are affected by the Port Authority toll plan.

Describe the economic benefit here.

HS.ETS1.1
0.5
Pitanje 32b
32b.

Discuss the wants and needs of society here.

HS.ETS1.1
Pitanje 33
33.

Which table below correctly summarizes the benefits of extracting lithium by mining or the reservoir brine method?

Pitanje 34
34.

Which statement correctly identifies the changes to the lithosphere that were needed for reservoir brine lithium extraction in Chile between 1995 and 2022?

Pitanje 35
35.

Which statement correctly identifies how the processing and management of saline brine for lithium production in the Atacama region of Chile negatively impacts the Andean flamingo habitat?

Pitanje 36
36.

In addition to increased carbon dioxide emissions, which row in the table below correctly describes the factors and their effect on coastal flooding in areas where ghost forest land cover has increased from 1920 to 2020?

Row

Total Change in Temperature Anomaly

Total Global Sea Level Anomaly

Coastal Flooding

1

$-0.9\degree$ C

70 mm

decreased

2

$-0.9\degree$ C

195 mm

decreased

3

$0.9\degree$ C

195 mm

increased

4

$0.9\degree$ C

70 mm

increased

0.5
Pitanje 37a
37a.
HS.ESS3.1
0.5
Pitanje 37b
37b.

Effect on human activity:

HS.ESS3.1
Pitanje 38
38.

A student makes the claim that the amount of living forest acreage will decrease as the amount of ghost forest acreage increases in the coastal area near this residence. Which associated impact to an Earth system will most likely occur?

0.5
Pitanje 39a
39a.

Use the model to compare the temporal scale of land subsidence associated with the earthquake to the temporal scale of land subsidence associated with the development of a ghost forest.

Temporal scale of land subsidence associated with an earthquake:

HS.ESS2.1
0.5
Pitanje 39b
39b.

Temporal scale of land subsidence associated with the development of a ghost forest:

HS.ESS2.1
Pitanje 40
40.

Which three proposed solutions reduce the expansion of ghost forests and would most likely be accomplished with minimal environmental impact and maximum aesthetic value to local residents?

Pitanje 41
41.

Based on the information from Simulation 1 and Simulation 2, which row in the table below correctly matches both a method of managing natural resources and the resulting effect on human population, greenhouse gases in the atmosphere, and biodiversity beginning in 2020?

Pitanje 42
42.

Based on the information in both graphs, which statement correctly identifies the relationship between the management of fossil fuels since 1950 and the future sustainability of these resources?

Pitanje 43
43.

Based on the graphs and table, which statement correctly provides evidence to support the claim that increased consumption of fossil fuels caused a change in the amount of world arable land per person?

0.5
Pitanje 44a
44a.

Describe how the manufacturing of Bushblok logs addresses a problem in Namibia. Explain how these logs benefit the cheetah population and reduce the impact of human activity on cheetah habitat in Namibia.

Problem:

HS.ESS3.4
0.5
Pitanje 44b
44b.

Benefit:

HS.ESS3.4
Pitanje 45
45.

Increasing the use of biomass is one of many actions that the CCF is taking to reduce the rate of climate change. Which additional solution, if increased, could be used along with biomass as another renewable energy source?

Pitanje 46
46.

Which table correctly pairs the Earth process with the surface feature that created the Hawaiian Islands chain?

0.5
Pitanje 47a
47a.

A student makes a claim that the motion of the Pacific Plate can be used to determine the pattern of ages of the Hawaiian Islands. Use evidence from the maps to describe the relationship between the pattern in the ages of the islands and the compass direction that the Pacific Plate is moving.

Pattern in ages:

HS.ESS1.5
0.5
Pitanje 47b
47b.

Compass direction of movement:

HS.ESS1.5
Pitanje 48
48.

Between which islands were the samples collected?

Pitanje 49
49.

Based on the models, which table correctly identifies the spatial change, the temporal change, and one possible surface process that contributed to the evolution of Big Maui?

0.5
Pitanje 50a
50a.
HS.ESS3.4
0.5
Pitanje 50b
50b.

How solutions reduce impact:

HS.ESS3.4