


1
HS.ESS1.2
1
HS.ESS1.2
1
HS.ESS1.3
1
HS.ESS1.3
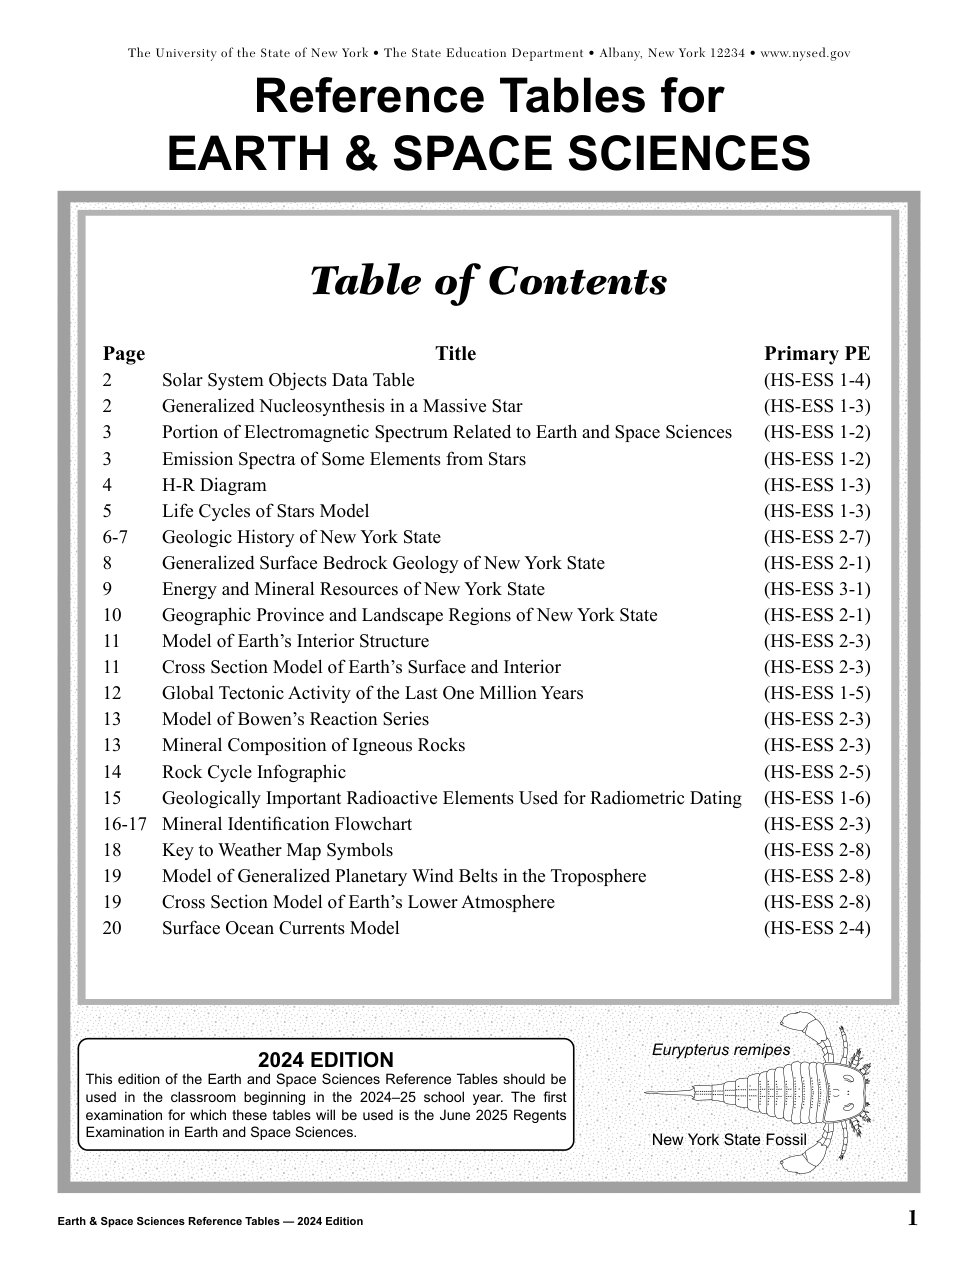
A four-function or scientific calculator and a copy of the 2024 Edition Reference Tables for Earth and Space Sciences must be available for you to use while taking this examination. Note that diagrams are not drawn to scale unless otherwise noted.
A four-function or scientific calculator and a copy of the 2024 Edition Reference Tables for Earth and Space Sciences must be available for you to use while taking this examination. Note that diagrams are not drawn to scale unless otherwise noted.
Base your answers to questions 1 through 5 on the information below and on your knowledge of Earth and Space Sciences.
Some questions may require the use of the 2024 Edition Reference Tables for Earth and Space Sciences.
Evidence for the Big Bang Theory
The Big Bang is a physical theory that describes how the universe expanded from an initial state of high density and high temperature. The theory attempts to explain how the universe has changed over time. Three pieces of evidence are used to support this theory. The measured amounts of elements in the universe supports this theory. The observed expansion of space that is accelerating is another piece of evidence. Also, the discovery of cosmic microwave background radiation (CMBR) supports the theory.
The model below shows some information about how the universe has changed since the Big Bang event. Temperatures in the model are in Kelvin (K).
Evolution of the Universe Since the Big Bang Model

Complete each of the three statements below to correctly describe cosmic microwave background radiation by selecting the phrase that correctly completes each statement.
Statement 1:
Cosmic microwave background radiation provides evidence of the Big Bang because it is
In the 1920s, astronomer Edwin Hubble studied galaxies using a type of star called a Cepheid variable. These types of stars brighten and fade in a predictable pattern. Hubble observed these stars to determine how far away these stars, and the galaxy in which they are located, are from Earth.
A reproduction of Hubble’s 1929 graph is shown. Recessional velocity of a galaxy (speed relative to Earth) is plotted as a function of distance from Earth to the galaxy. It is measured in parsecs (1 parsec = 3.26 light years). Galaxies traveling toward Earth have negative recessional velocities.
 Several statements about Hubble’s work related to galaxies are listed below.
Statement 1: Hubble’s graph shows that there is no relationship between the distance of a galaxy from Earth and the galaxy’s recessional velocity.
Statement 2: The evidence for speeds of most galaxies on Hubble’s graph was most likely obtained from red-shift data for each galaxy.
Statement 3: Galaxies measured by Hubble that were 2 3 106 parsecs away from Earth all have a recessional velocity greater than 500 km/s. Statement 4: Hubble’s graph shows a proportional relationship between distance of a galaxy from Earth and the galaxy’s recessional velocity. Statement 5: Some galaxies shown on Hubble’s graph are traveling slower as they get farther from Earth. Statement 6: The evidence for speeds of most galaxies on Hubble’s graph was most likely obtained from blue-shift data of each galaxy.
Which statements correctly summarize Hubble’s data as evidence to support the Big Bang Theory?
How does the data in the graph support an explanation of the Big Bang theory?
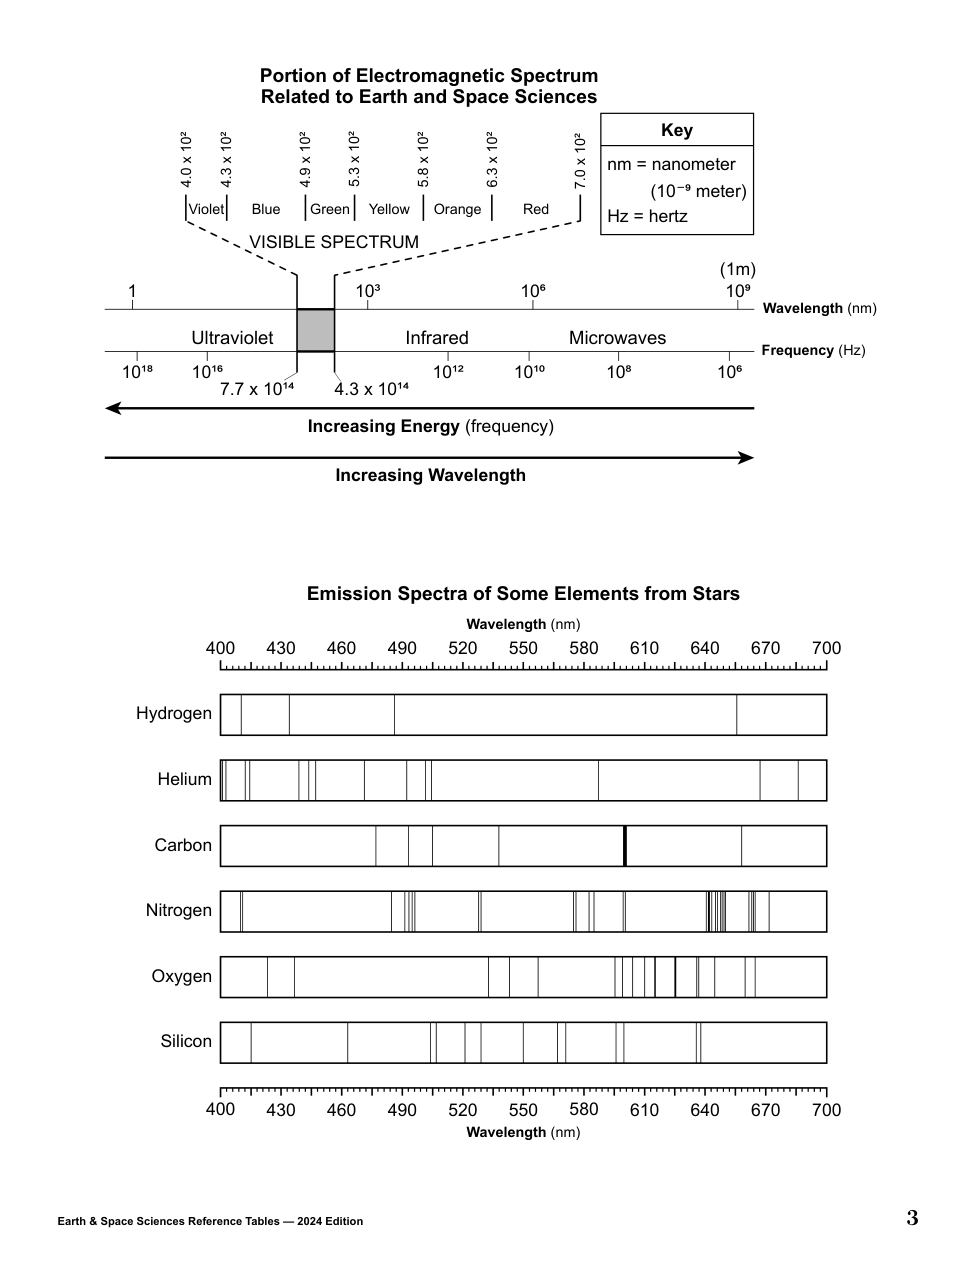
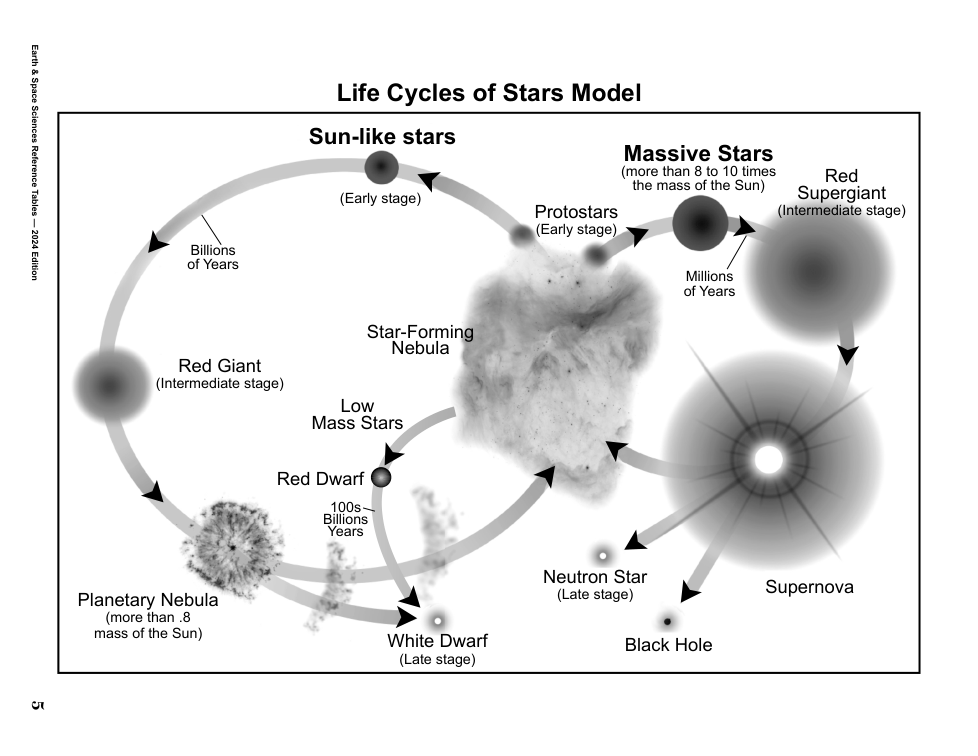
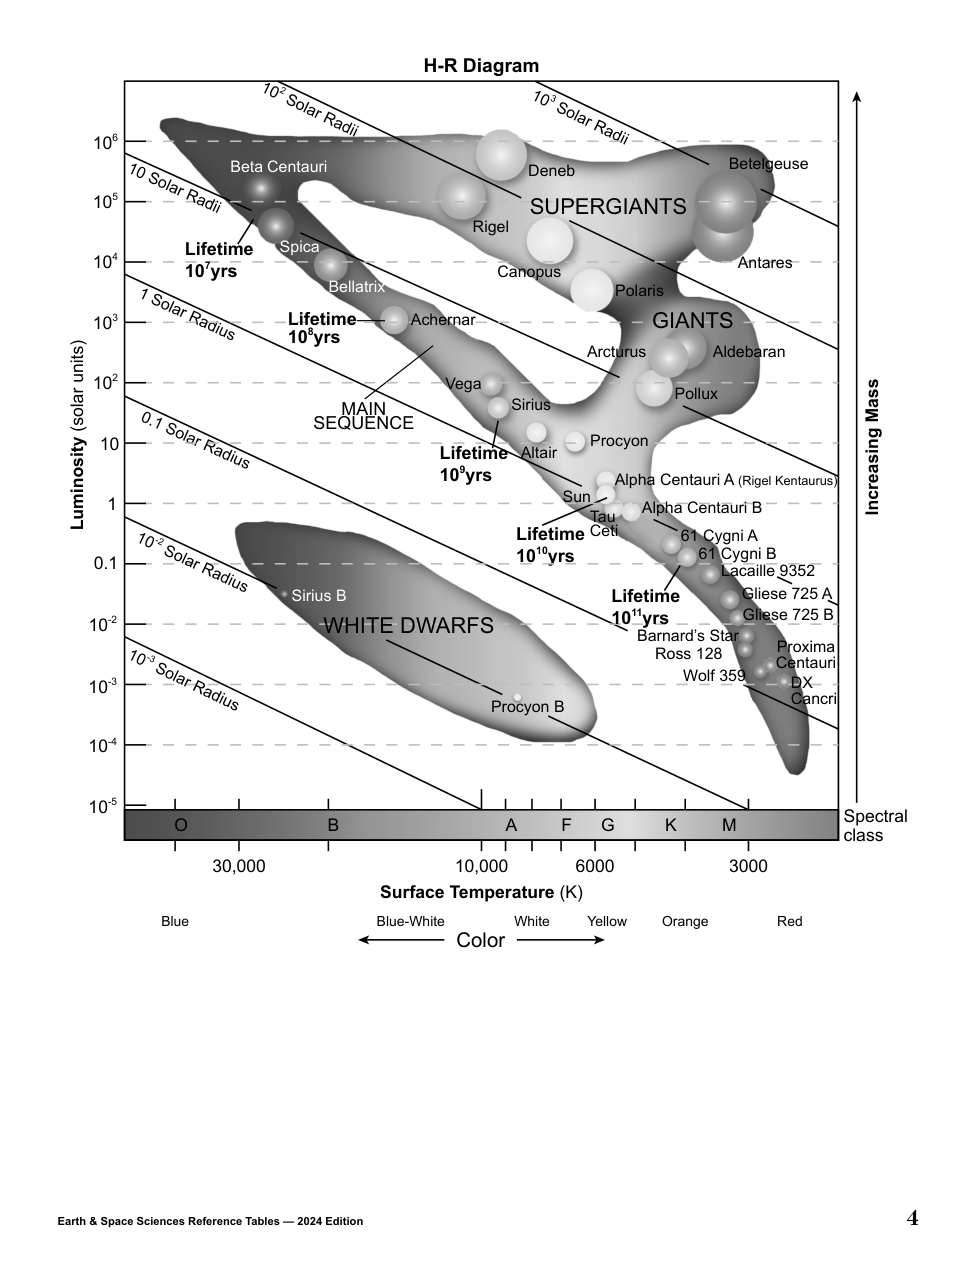
The table below shows some information about two stars in the Milky Way galaxy.
Stars | Elements Composing Star | Mass (kg) |
|---|---|---|
Betelgeuse | Helium, carbon, oxygen, neon, magnesium, sodium, iron | |
The Sun | Hydrogen, helium |
Which statement correctly explains the difference in the elements composing the two stars and compares the lifespans of these two stars?
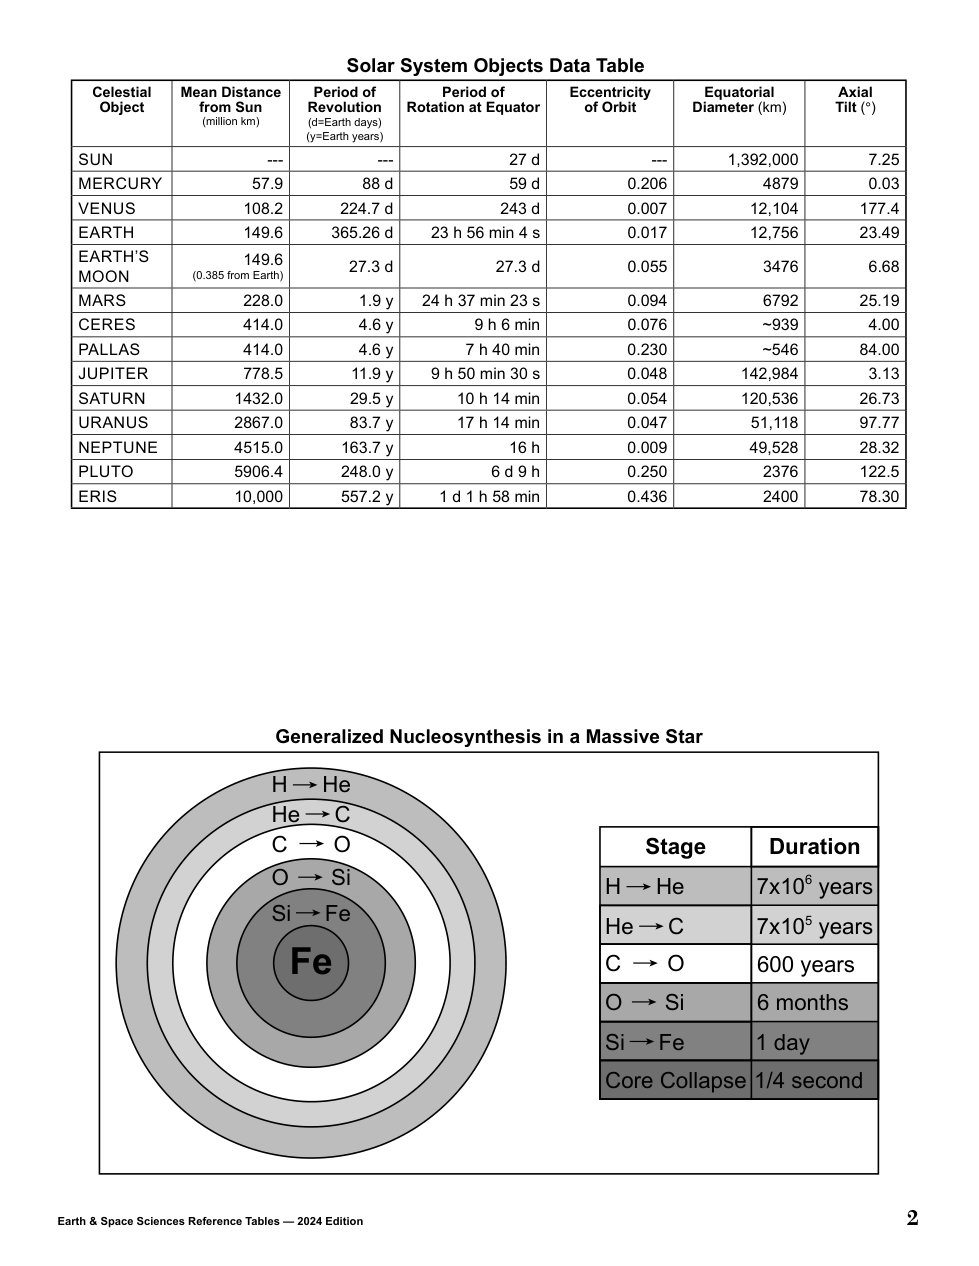
Explain how the masses of Betelgeuse and the Sun are a factor in the rate of nucleosynthesis being different for each star.
Base your answers to questions 6 through 9 on the information below and on your knowledge of Earth and Space Sciences. Some questions may require the use of the 2024 Edition Reference Tables for Earth and Space Sciences.
Rubber Ducks and Pacific Ocean Trash
On January 10, 1992, the container ship, Ever Laurel, lost twelve 40-foot containers during a storm at sea. One container broke open and released over 28,000 plastic bath toys into the ocean. These bath toys floated on the ocean surface for years and made landfall on beaches worldwide.
The Pacific Ocean is home to the Great Pacific Garbage Patch (GPGP). This island of plastic is 1.6 million square km in size—approximately 11-times the size of New York State. Garbage patches are found worldwide within ocean gyres where water conditions are calm. Scientists have been studying the sizes, compositions, and ages of the plastic pieces in the patch to determine the origin of the plastic in order to mitigate the problem of increasing plastic pollution in ocean ecosystems.
The map below contains some information about the Ever Laurel accident, locations where bath toys were found, and the Great Pacific Garbage Patch.
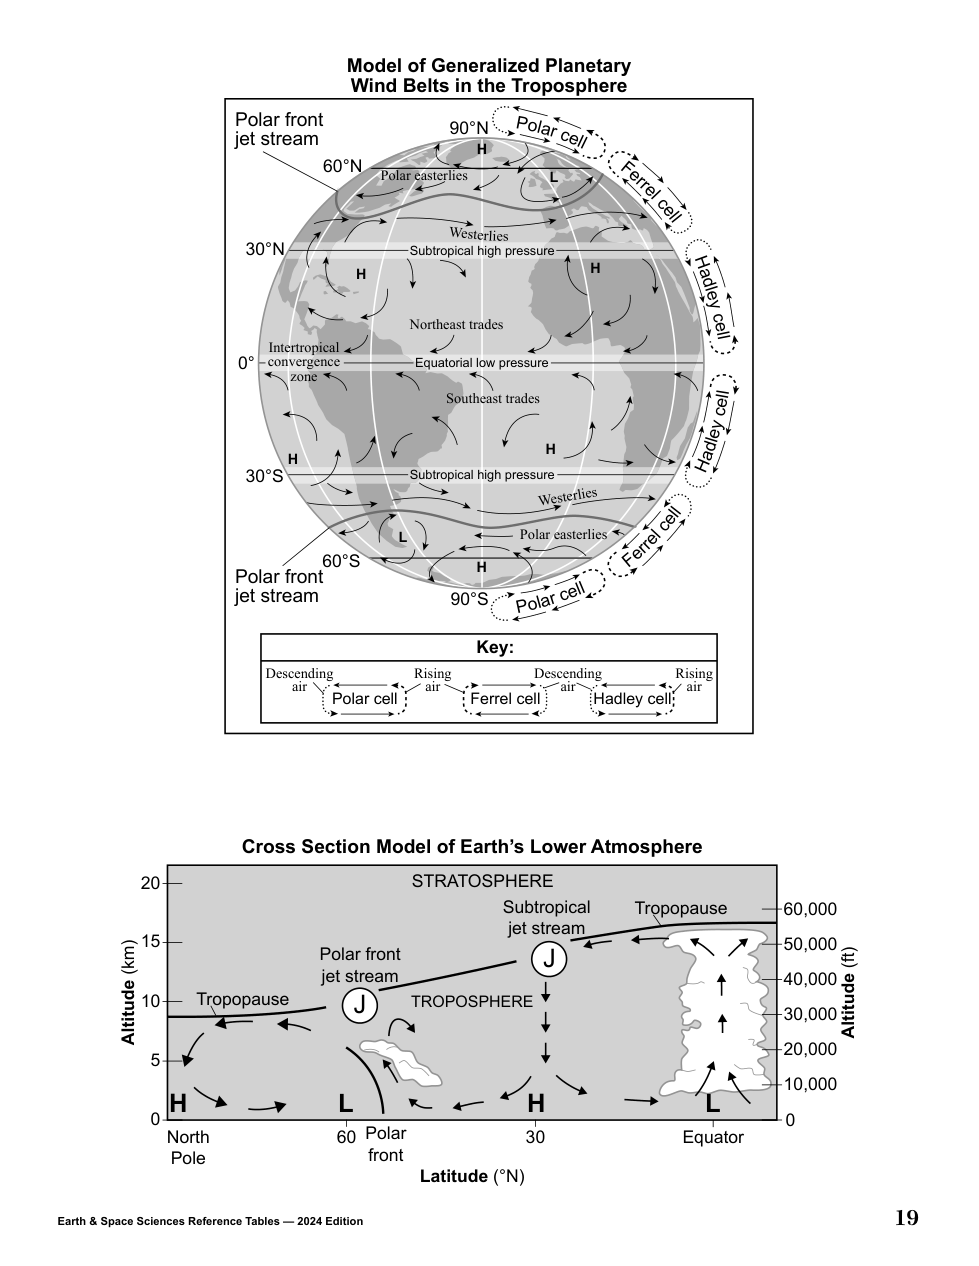
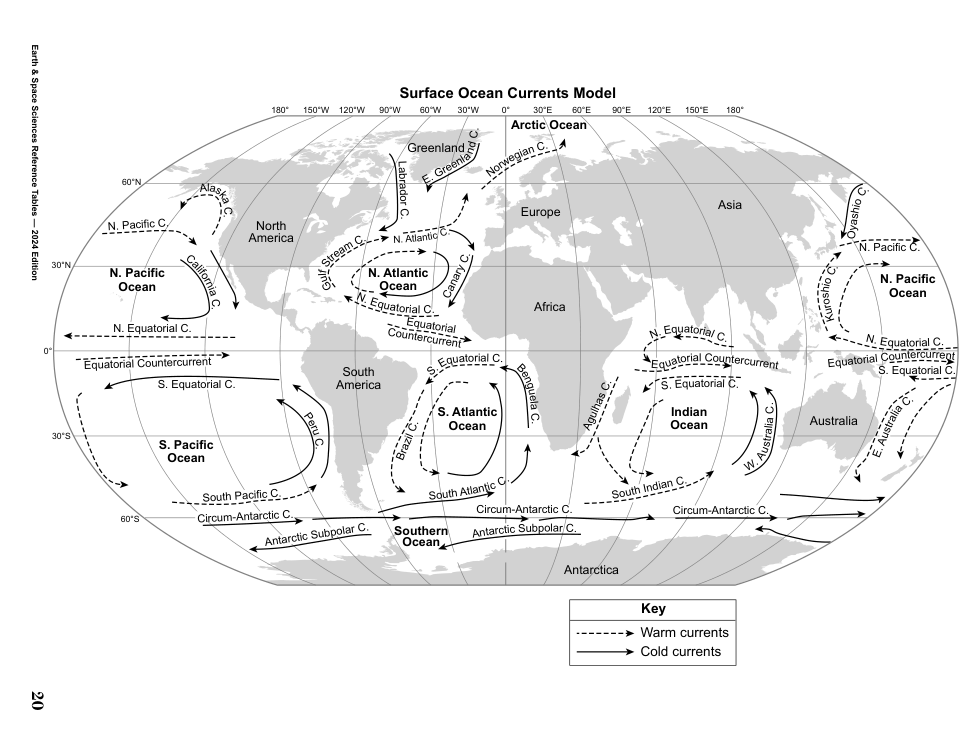
Complete each of the three statements below by selecting the option that correctly describes the factor responsible for global atmospheric and oceanic circulation patterns that distributed the bath toys to various locations on Earth.
Statement 1:
Evidence for the distribution pattern of the plastic bath toys from the accident location to the northwest coast of North America is provided by
Other than ocean currents, what other factor determines the global circulation of these plastic toys?
Many types of plastic are found in Earth’s oceans. The pie charts and infographic below show some information about plastic in Earth’s oceans. Arrows in the infographic represent the transfer of plastics through different organisms.
Plastic Sources Found in the GPGP Greater Than 5 cm

Transfer of Plastics in the GPGP Through Marine Food Chain to Humans
Sea turtles in the GPGP often feed on plastic bags and plastic sheets. This is because the turtles mistake the plastic for their common prey, jellyfish.
Which statement explains how the removal of plastic bags in the GPGP will stabilize biodiversity in the area?
Many organizations and governmental bodies have investigated methods to address the growing problem of plastic pollution. These methods include reducing the use of plastics, recycling plastics, and participating in waterway cleanups.
More complex solutions are being used to clean up rivers and oceans. In rivers, barriers at the mouth of the river funnel the plastic into a collection area where the plastic is manually removed and hauled away to be recycled. In oceans, scientists use a device to collect floating plastic and bring it back to shore for recycling. The photograph and model below show some information about these two removal methods.
River Removal Method
Model of Ocean Removal Method

The chart below shows some information about the methods for removing plastics from water.
Pros | Cons | |
|---|---|---|
River |
|
|
Ocean |
|
|
A student makes a claim that the river cleanup method is a more effective design solution than the ocean cleanup method for reducing the impact of plastic pollution. Using all the information provided, which statement provides the most correct evidence to support this claim?
Base your answers to questions 10 through 13 on the information below and on your knowledge of Earth and Space Sciences. Some questions may require the use of the 2024 Edition Reference Tables for Earth and Space Sciences.
Evolution of Early Earth Systems
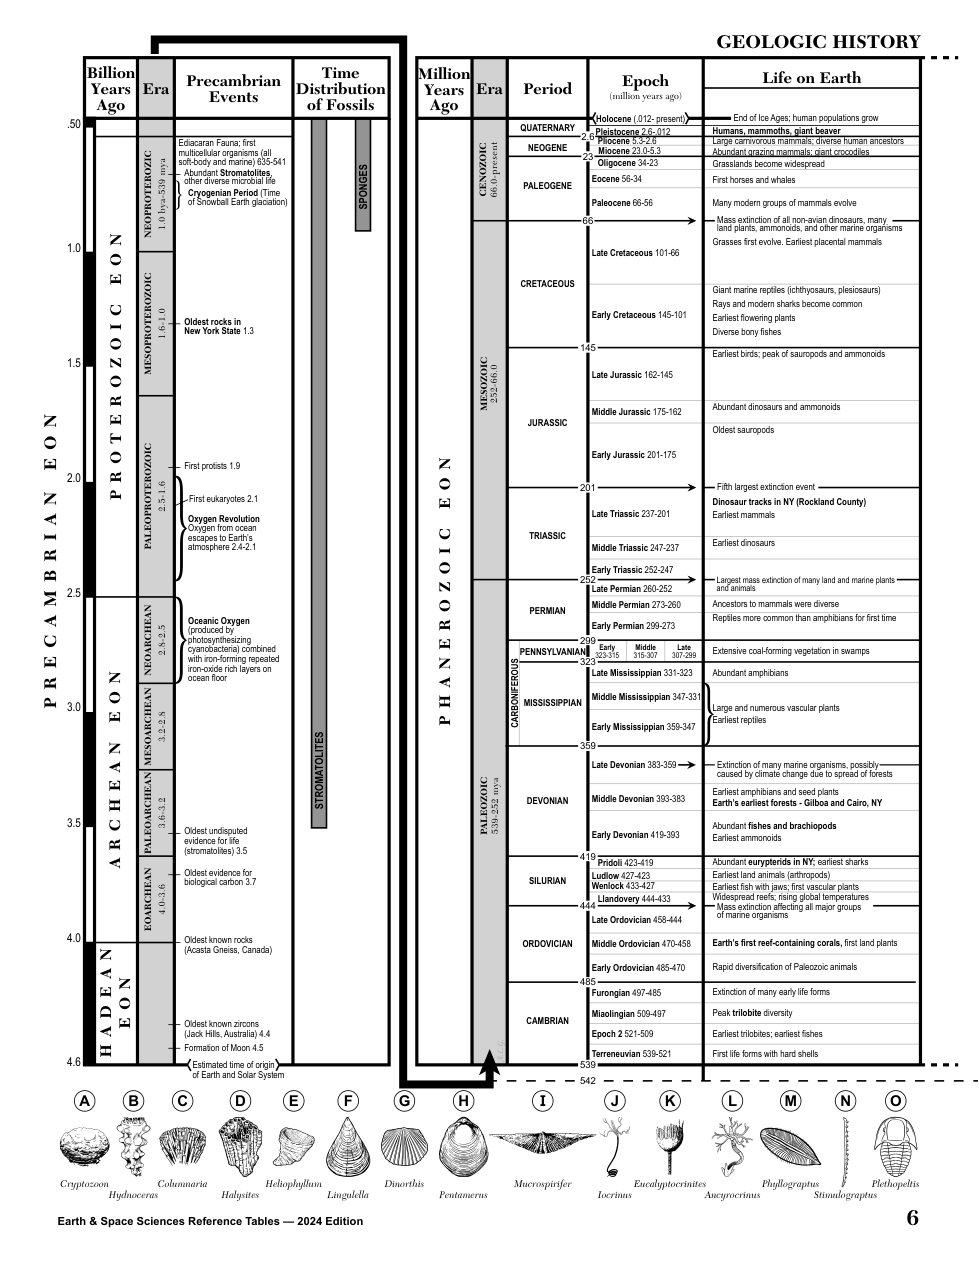
Around 2.7 Ga (billion years ago) microbes called cyanobacteria (that formed stromatolites) evolved in oceans. These microbes performed photosynthesis. They had the ability to use water as a “fuel” to make oxygen. This oxygen was released into the seawater. Its level gradually increased over a span of about 200 to 300 million years. Eventually, it escaped into the atmosphere where it reacted with methane. This reaction caused methane levels to decrease and oxygen levels to increase. This occurred about 2.4 to 2.1 Ga. This increase in atmospheric oxygen is called the Great Oxidation Event. These oxygen-level changes on Earth indirectly led to climate change.
The models below represent the relative amounts of different types of energy reaching Earth, reflected from Earth, and absorbed by Earth’s atmosphere during two different time periods.
Models of Great Oxidation Events

Which row in the table below correctly describes the evidence for the coevolution of Earth systems as a result of the Great Oxidation Event?
Row | Change to Atmospheric Gas | Response to Change | Effect on Climate |
|---|---|---|---|
1 | Methane level decreased; oxygen level increased | Less energy absorbed by atmosphere | Led to earliest ice age due to increased reflection of energy |
2 | Methane level increased; oxygen level decreased | More energy absorbed by atmosphere | Led to earliest ice age due to decreased reflection of energy |
3 | Methane level increased; oxygen level decreased | Less energy absorbed by atmosphere | Led to earliest ice age due to increased reflection of energy |
4 | Methane level decreased; oxygen level increased | More energy absorbed by atmosphere | Led to earliest ice age due to decreased reflection of energy |
The Huronian ice ages were three separate glacial events that occurred between 2.4 to 2.1 Ga. These were among the earliest ice ages of Earth’s geologic history. The planet’s surface was almost entirely frozen at this time.
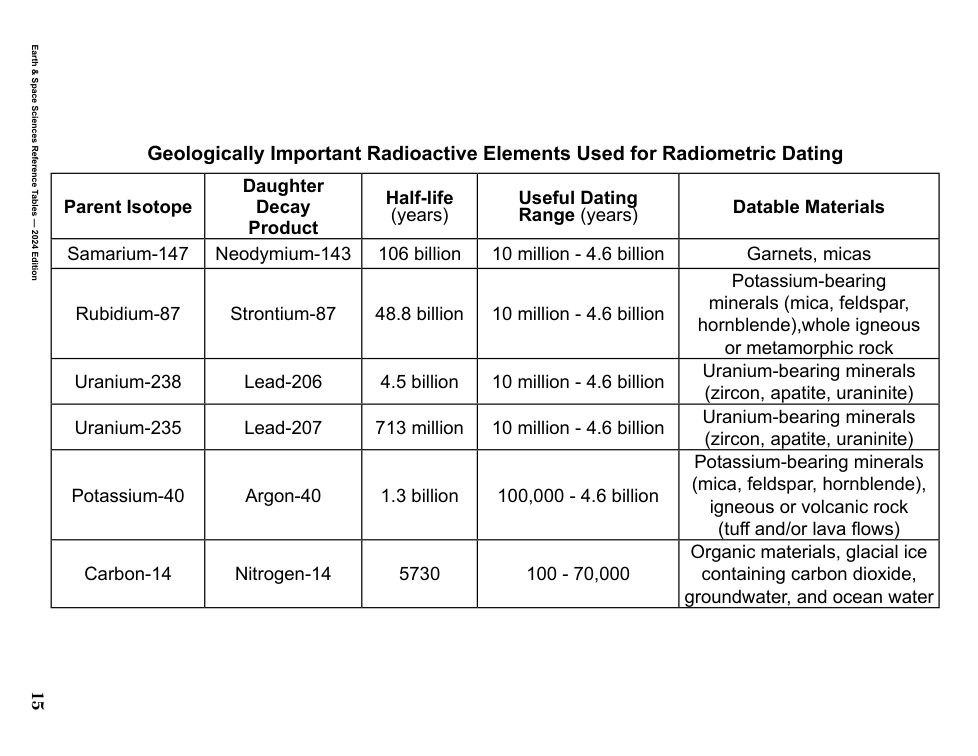
The Huronian Supergroup is a group of geologic formations, 12-kilometers thick. These formations provide evidence of the first major glacial episode. The age of these formations was determined using the ratio of uranium to lead isotopes in rocks. This supergroup formed when this ice-covered landmass was closer to the equator than it is now when the ice reached to sea level.
The Huronian Supergroup is typical of deposits in a marine environment. It consists of sedimentary rock that includes dropstones (embedded volcanic and/or sedimentary fragments). Dropstones are evidence for glacial ice ages because glaciers carry different-sized sediments in the ice. Glaciers then drop these rocks at sea. They become embedded in marine sediments that eventually form sedimentary rock.
Which statement identifies the evidence used to determine when the Huronian ice age occurred?
Among the oldest rocks on Earth are sedimentary rocks known as banded iron formations. These rocks formed in oceans containing some of Earth’s first available free oxygen. The model below shows some information about Earth’s early ocean and atmosphere. All geologic times are approximate. Billion years ago is represented by Ga and million years ago is represented by mya.
Model of Earth's Early Ocean and Atmosphere

Which statement correctly uses information from the model and passages as evidence to support the claim that, during the end of the Huronian ice age, changes in Earth’s hydrosphere caused a change in Earth’s geosphere?
Earth’s surface processes cause changes to Earth’s surface and atmosphere. Past changes produced conditions that led to future events.
Using the information provided in the model, place the list of events below in the correct temporal sequence to complete the graphic organizer.
Events
First oceans form
The Great Oxidation Event
First appearance of banded iron formations
Iron enters the ocean from black smokers
Formation of Earth

First appearance of banded iron formations
First oceans form
Iron enters the ocean from black smokers
The Great Oxidation Event
Formation of Earth
Base your answers to questions 14 through 18 on the information below and on your knowledge of Earth and Space Sciences. Some questions may require the use of the 2024 Edition Reference Tables for Earth and Space Sciences.
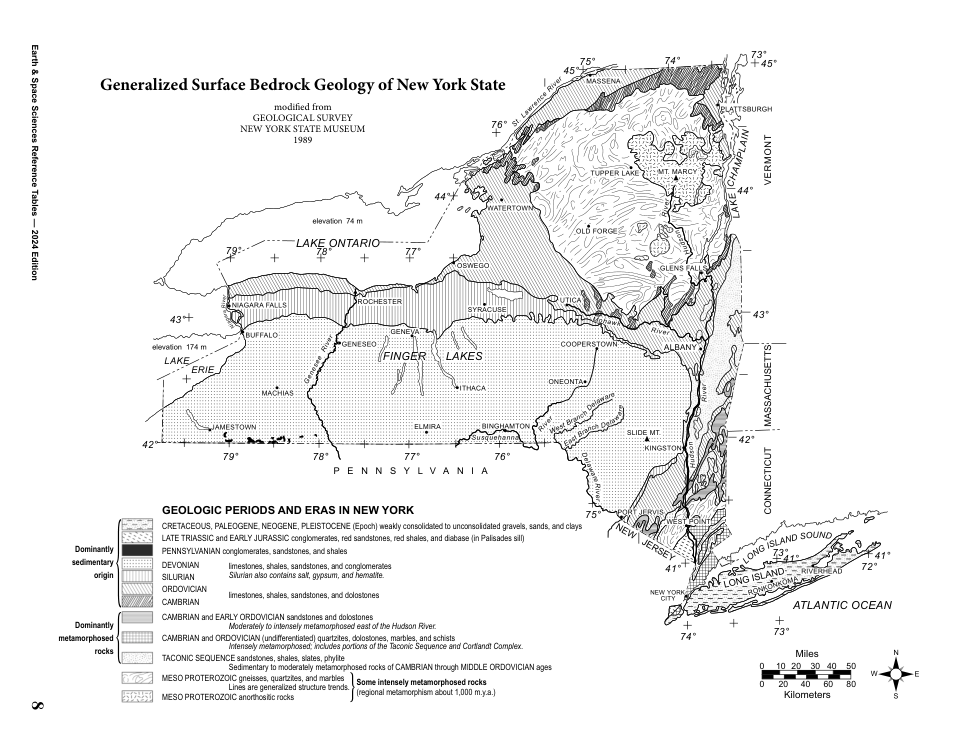
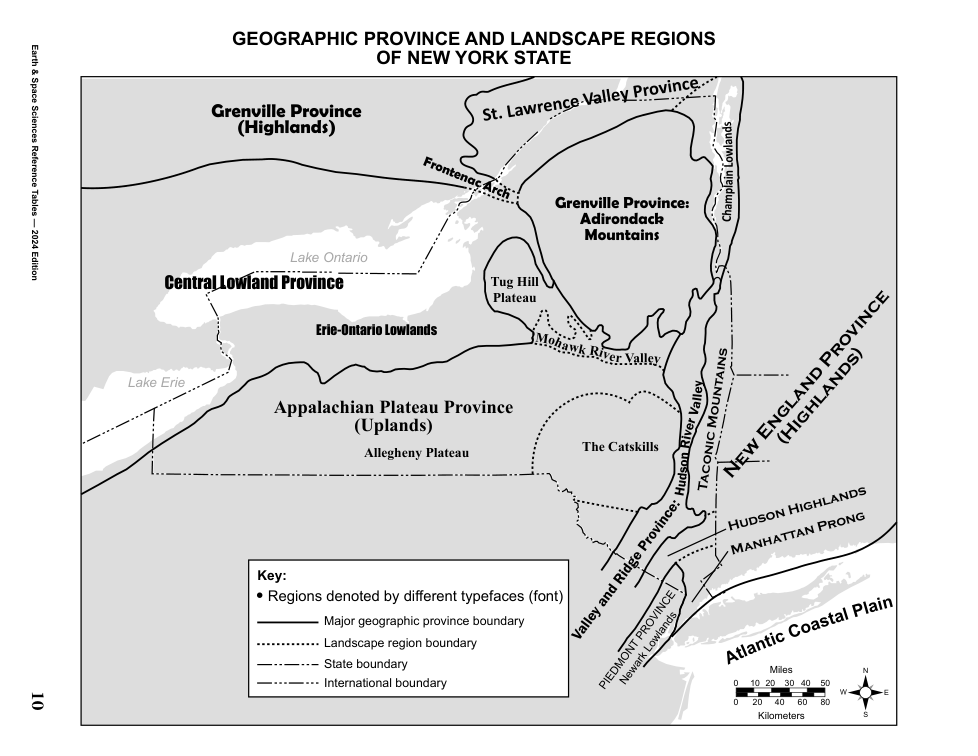
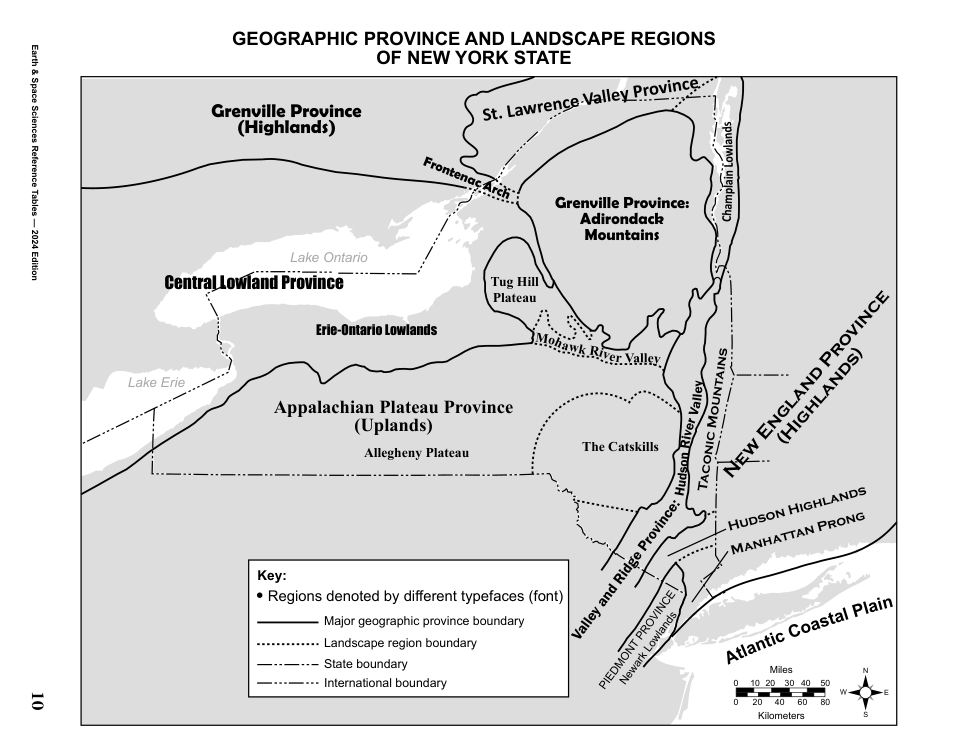
Mined and Mineral Resources of New York State
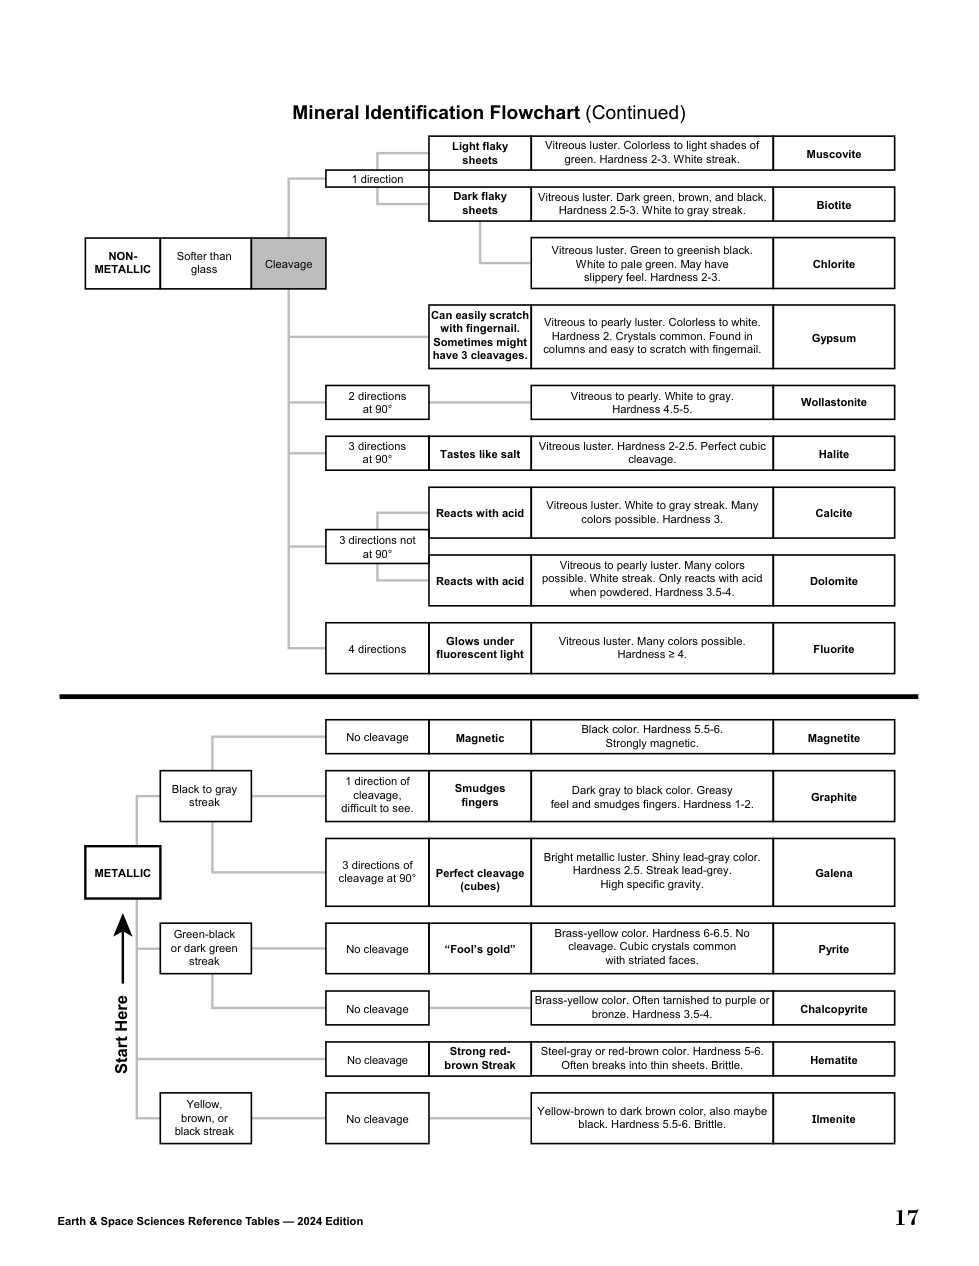
A class was investigating mined and mineral resources in New York State. On a trip to the Adirondacks, the teacher told the students that the mineral crystals embedded in many rocks found in the Adirondacks were actually the New York State mineral. This mineral was an important source of abrasives.
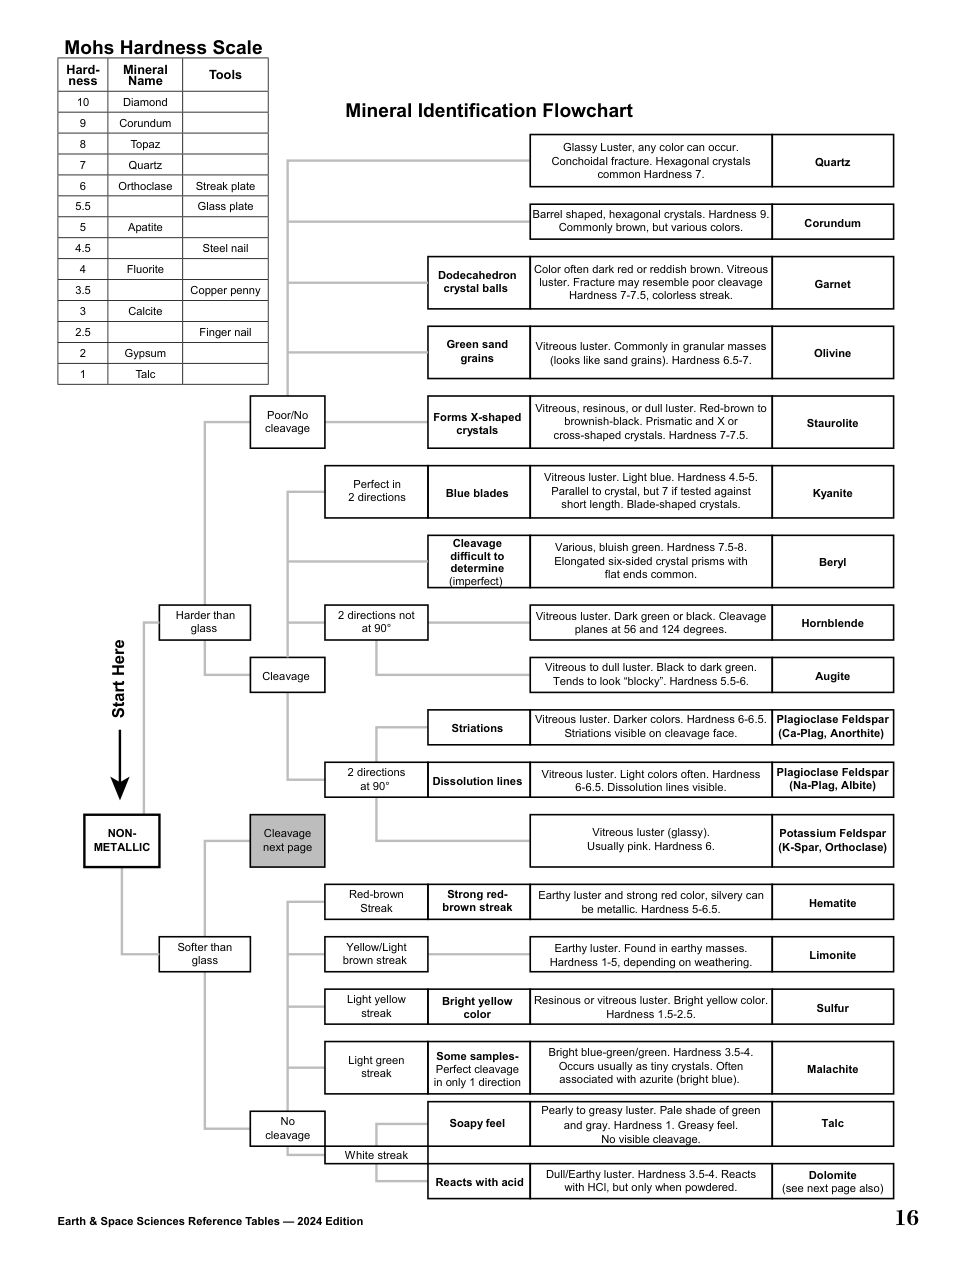
A student found several of these rocks on the trip. They recorded observations about the physical properties in order to try to identify these large minerals embedded in the rock. They took a photograph of the rock, which is shown below, and listed observations, also below.
Adirondack Rock with Mineral Crystals
 Observations:
A. The mineral inclusions are dark red in color and glassy-looking.
B. The mineral crystals are embedded in a rock with several dark and light minerals mixed together.
C. The mineral crystals are able to scratch glass and have a colorless streak.
D. The rock was found at a high elevation.
E. The mineral crystals in the rock broke into uneven pieces with sharp edges.
F. The rocks containing these minerals were very dense.
Based on the student’s observations, which set of observations and mineral name correctly identifies the mineral crystals in the photograph?
Limestone and dolostone mines comprise the third largest number of mines in New York State. These rocks are primarily used as crushed stone in the construction industry.
The maps below show some information about mines and major highways in New York State.
Limestone and Dolostone Mines 2020

Major Highways in New York State

Using evidence from the maps, construct an explanation that describes how a human activity may have been affected by the availability of limestone and dolostone in New York State.
Mines in New York State must be “reclaimed” when the mine is no longer in operation. This means the environmental effects of the mine must be reversed by returning the land to an ecological or economically usable condition.
The photographs below show two stages of reclamation of the Woodbourne Flats Mine in Sullivan County, New York. Photograph 1 shows a portion of the Neversink River with 600 newly planted indigenous black willow trees. Photograph 2 shows a human-made, 35-acre pond. It is surrounded by planted vegetation natural to that area.

Write the correct letters from the choices below at the end of each sentence to complete each statement about the reclamation of the Woodbourne Flats Mine.
Choices for Statement 1:
A– stabilize river banks and reduce deposition of sediment along the river banks
B– stabilize river banks and reduce the impact of flooding events
Choices for Statement 2:
C– capture sediment-laden storm water to be used as a source for drinking water in a nearby housing complex
D– capture runoff from the surrounding area and reduce the amount of sediment released into the nearby river
Choices for Statement 3:
E– stabilize slopes and restore habitat of the original ecosystem
F– stabilize slopes and introduce non-native plants to the original ecosystem
Statement 1: The planting of the black willow trees will
Statement 2: The creation of the 35-acre pond will
Statement 3: The planting of vegetation around the pond will
Paved road surfaces are typically constructed from a mixture of aggregates (sand, gravel, and crushed stone). It is held together by an emulsifier. An emulsifier is a sticky, tar-like substance made from petroleum. Historically, natural sources (quarried stone) were used for road construction. A newer method of road resurfacing, called recycled asphalt pavement (RAP), has been used on road resurfacing projects. Some differences between these two resurfacing methods are described in the table below. The model shows the equipment used on a RAP resurfacing project.
Natural Paving Materials | Recycled Asphalt Pavement | |
|---|---|---|
Aggregate Source | Quarry rock is blasted from Earth's surface and hauled by truck to a processing plant. | Milling machines grind existing road surfaces for use on-site. |
Aggregate Processing | Stone is crushed, sorted, and dried before being mixed with 3 to 7% emulsifier. | Millings are mixed with 1 to 3% emulsifier. |
Materials Transport | Natural paving materials are taken by truck from the quarry to the site, often several miles away. | Milled material does not require transportation to the site of road resurfacing. |
Mining Impacts | Quarried stone is taken from surface mines that will require reclamation. | Recycled material does not have to be mined and reclamation is not required. |
Recycled Asphalt Paving (RAP) Model

Which statement below correctly identifies a benefit to a local community when comparing these two design solutions for resurfacing roads?
Natural material is sometimes blended with RAP at the asphalt plant. The percentage of RAP mixed with natural material is called blending ratio. The graph below shows some information about pavement recycling.
Effect of RAP Blending Ratio on Carbon Emissions from the Entire Process of Pavement Recycling

Which row in the table below correctly identifies how the use of RAP in the paving of roadways influences the
Row | RAP Blending Ratio (%) | Carbon Emissions (kg | Impact on Climate |
|---|---|---|---|
(1) | Increase | Increase | Increased global warming |
(2) | Decrease | Increase | Decreased global warming |
(3) | Increase | Decrease | Decreased global warming |
(4) | Decrease | Decrease | Increased global warming |
Base your answers to questions 19 through 23 on the information below and on your knowledge of Earth and Space Sciences. Some questions may require the use of the 2024 Edition Reference Tables for Earth and Space Sciences.
The Moons of Pluto
In addition to the eight planets, our solar system consists of other celestial objects, including dwarf planets. Discovered in 1930, Pluto is one of the largest dwarf planets in our solar system. Pluto has five moons, the largest being Charon. Charon is about half the size of Pluto, leading some scientists to refer to these celestial bodies as a double dwarf planet system.
The model below shows some information about the Pluto–Charon binary system. The orbit of Charon around Pluto is not shown.
Model of Orbits of Pluto's Moons - July 7, 2012

Pluto’s Moons
Name of Moon | Average Orbiting Distance (km) | Eccentricity |
|---|---|---|
Charon | 19,640 | 0.0022 |
Hydra | 64,738 | 0.0059 |
Kerberos | 57,783 | 0.0033 |
Nix | 48,694 | 0.0020 |
Styx | 42,656 | 0.0058 |
Using the model and data table, complete the List of Moons below to rank the moons in order of increasing orbital period around Pluto.
List of Moons
Justify your response to the List of Moons question above using one of Kepler's laws.
Based on the information in the Pluto’s Moons data table, which row in the table below correctly describes the orbital speed of Styx and the gravitational force of attraction exerted on Styx by Pluto as it orbits Pluto?
Row | Orbital Speed | Gravitational Force |
|---|---|---|
(1) | Constant | Constant |
(2) | Not constant | Constant |
(3) | Constant | Not constant |
(4) | Not constant | Not constant |
The model below shows some information about Pluto’s orbit around the Sun and Charon’s orbit around Pluto.
Model of Pluto-Charon System

The data table below shows some information about Pluto and Charon.
Celestial Body | Diameter (km) | Rotational Period (Earth days) | Orbital Period (Earth days) |
|---|---|---|---|
Pluto | 2377 | 6.4 | 90,560 |
Charon | 1214 | 6.4 | 6.4 |
Which pieces of evidence shown in the model and data table support the claim that the phases of Charon as viewed from Pluto change cyclically?
A student makes the following claim:
The same side of Charon always faces Pluto to an observer on Pluto, just like the same side of the Moon always faces Earth to an observer on Earth.
Click to select either the Support or Refute options below to indicate if the given information supports or refutes the student's claim.
Justify your response using evidence from the information provided.
Charon was first discovered in 1978 at the U.S. Naval Observatory. The four smaller moons were discovered between the years 2005 and 2012 using the Hubble Space Telescope. Some researchers have suggested that all five moons could be debris from the impact of an object with Pluto. Others theorize that the four smaller moons were created from an impact with Charon.

Which statement would provide evidence for the formation of Pluto’s four smallest moons from a possible impact with Pluto or Charon?
Base your answers to questions 24 through 27 on the information below and on your knowledge of Earth and Space Sciences. Some questions may require the use of the 2024 Edition Reference Tables for Earth and Space Sciences.
Doggerland
Doggerland was an area of land once occupied by ancient humans. Glaciers once covered the area but melted between

Which claim summarizes the climate change that most likely occurred at Dublin, Ireland, over the last 18,000 years?
The underwater Storegga landslide also affected the Doggerland region. The map below shows some information about the Storegga Slide and the associated tsunami that occurred 8200 years ago.
 The Hommelstø Sediment Cross-Section was drawn after tsunami deposits were analyzed at Hommelstø, Norway.

Which row correctly completes the passage below?
When the Storegga Slide triggered a tsunami, the initial wave would have caused a ___A___ process at the coastline of the Shetland Islands. The coastline would have experienced ___B___. The location of ___C___ experienced less impact from the tsunami with a wave height of about ___D___.
Row | A | B | C | D |
|---|---|---|---|---|
(1) | constructive | erosion | Faroe | 14 meters |
(2) | constructive | deposition | Lyngen | 2 meters |
(3) | destructive | erosion | Hommelstø | 3 meters |
(4) | destructive | deposition | Bijgun | 6 meters |
Students analyzing the Hommelstø Sediment Cross-Section made the five claims below.
Claims
I – Marine gastropods are the oldest remains of organic material.
II – The tsunami deposits contain the largest-sized sediments.
III – Peat and soil clasts are only found at depths of 640 cm.
IV – Twigs, leaves, and moss in these deposits contain more than 75% of their original carbon-14.
V – The sediments and organic material at the 600 cm depth are most likely freshwater deposits.
Which three claims provide correct interpretations from data collected at Hommelstø?
Since 1994, England has once again been connected to France, but not by a land bridge like Doggerland. The high-speed Eurostar train uses the Channel Tunnel to carry 11 million travelers under the English Channel every year. Prior to 1994, travelers crossing the English Channel relied mostly on airplanes and ferries. The infographic below shows some information about carbon emissions for different modes of travel.
The Average Amount of Carbon Released (g/km) per Passenger

Identify the Earth system that is being impacted the least by the Eurostar train. Use numerical evidence to explain how this solution reduces the impact on the system.
Earth system:
Explanation:
Base your answers to questions 28 through 32 on the information below and on your knowledge of Earth and Space Sciences. Some questions may require the use of the 2024 Edition Reference Tables for Earth and Space Sciences.
Greenland’s Glacial Ice
The Greenland ice sheet is a large body of ice that covers about 80% of the landmass. This ice is a significant portion of Earth’s freshwater storage and plays an important role in Earth’s climate. For this reason, scientists have been studying how this ice sheet has been changing for many decades.
Map of Greenland Ice Coverage

Based on the map, which evidence-based claim correctly identifies how a change in climate most likely affected the current pattern of ice thickness on Greenland?
The graph below shows some information about the change in ice mass in Gt (gigatons–billions of tons) from the Greenland Ice Sheet.
Change in Ice Mass of Greenland Ice Sheet from 1971-2022

Using the information in the graph, make a claim that describes a feedback that occurs as a result of a change in ice mass on Greenland that caused a change to Earth’s oceans.
Based on the trend shown in the graph of Greenland ice mass, which claim correctly describes the rate of change in ice mass from 2010 to 2022?
The model below shows some information about the albedo effect. This is the effect of different types of Earth surfaces on the ability to reflect the Sun’s radiation. If sea ice reflects 60% of the Sun’s energy, then 40% of the Sun’s energy is absorbed by the sea ice.
Model of Percent of Sunlight Reflected by Various Surfaces

Using information in both the model and graph, write the correct letter from the choices below on the blank to complete each statement about the albedo effect.
Choices for Statement 1: | Choices for Statement 2: | Choices for Statement 3: |
|---|---|---|
A. 20% more radiation | D. flow into Earth’s surface | G. to cause regional and global cooling and cause sea level change |
Statement 1: Using the maximum values in the model, compared to bare ice melting on the Greenland ice sheet, as more soil/ground is exposed, approximately
Statement 2: More exposed ground on Greenland’s landmass will result in increased energy
Statement 3: The resulting effect on the climate of Greenland will be
The model below shows some information about ocean current circulation.
How Ocean Currents Work Model

The graph below shows information about some seawater characteristics. Salinity is measured in the number of grams of salts (chlorides) per kilogram of water or parts per thousand (ppt).
Seawater Density and Temperature for Different Salinities

Based on the model and the graph, which model below correctly summarizes changes to an Earth system off the coast of Greenland?

Base your answers to questions 33 through 37 on the information below and on your knowledge of Earth and Space Sciences. Some questions may require the use of the 2024 Edition Reference Tables for Earth and Space Sciences.
Bennu
Bennu is a small asteroid with an age of approximately 4.6 billion years. Bennu currently orbits the Sun at a mean distance of approximately
In 2016, NASA sent the OSIRIS-REx spacecraft to study Bennu. The asteroid’s surface was mapped in 2018. A sample of asteroid material was collected in 2020 and returned to Earth in 2023. Initial studies of the sample suggest Bennu’s original source contained water, ice, and carbon monoxide ice. Carbon monoxide ice forms at approximately 4500 million kilometers (
The model below shows some information about the paths of Earth, Bennu, and the OSIRIS-REx spacecraft.
Paths of Earth, Bennu, and OSIRIS-REx
 (Not drawn to scale)
A student wanted to identify the mathematical and computational information needed to determine when OSIRIS-REx could land on Bennu. Which table correctly lists the period of revolution and mean distance data needed to predict when OSIRIS-REx will cross Bennu’s orbit, allowing it to land on Bennu?
1 | |
|---|---|
Earth's Period of Revolution (Earth Days) | 365.26 |
Earth's Mean Distance from Sun (million km) | 149.6 |
Bennu's Period of Revolution (Earth Days) | 365.26 |
Bennu's Mean Distance from Sun (million km) | 169.0 |
2 | |
|---|---|
Earth's Period of Revolution (Earth Days) | 365.26 |
Earth's Mean Distance from Sun (million km) | 149.6 |
Bennu's Period of Revolution (Earth Days) | 370.26 |
Bennu's Mean Distance from Sun (million km) | 149.6 |
3 | |
|---|---|
Earth's Period of Revolution (Earth Days) | 365.26 |
Earth's Mean Distance from Sun (million km) | 149.6 |
Bennu's Period of Revolution (Earth Days) | 436.65 |
Bennu's Mean Distance from Sun (million km) | 169.0 |
4 | |
|---|---|
Earth's Period of Revolution (Earth Days) | 365.26 |
Earth's Mean Distance from Sun (million km) | 149.6 |
Bennu's Period of Revolution (Earth Days) | 436.65 |
Bennu's Mean Distance from Sun (million km) | 299.2 |
Which statement provides evidence about the formation and movement of Bennu through the solar system?
Scientists have calculated that there is a slight chance that Bennu could collide with Earth in 2182. The potential for an impact between Bennu and Earth has prompted studies to prevent this event. Three options have been proposed to address this concern.
The first option is to use a “kinetic impactor.” NASA has tested this option through a program called the Double Asteroid Redirection Test (DART). NASA carried out the experiment by striking Dimorphos with a small spacecraft at a speed of
A second option is to launch a nuclear warhead and have it explode near Bennu. The force of the explosion could alter Bennu’s orbital path.
A third option is the Yarkovsky Effect. This is a naturally occurring phenomenon on small asteroids. It happens when the Sun’s radiation strikes the object as it spins on its axis, changing its orbit over time. Scientists could increase the effect by painting or placing foil on the surface to increase the albedo of the asteroid.
Based on the cyclic motions of Bennu and Earth, describe the conditions that are necessary for Bennu to collide with Earth.
Which statement describes why the speed of the DART spacecraft changed before it impacted Dimorphos?
Place one check mark in each row to identify the option (Options 1 and 2 or Option 3) that meets the criteria and constraints listed in the table below.
(Scroll to the right to see all options)
Options 1 and 2 (DART/Nuclear) | Option 3 (Yarkovsky Effect) | |
|---|---|---|
Occurs Continuously | ||
Solar Radiation | ||
Risk of Debris Striking Earth | ||
Causes Rapid Change in Orbit |
Base your answers to questions 38 through 41 on the information below and on your knowledge of Earth and Space Sciences. Some questions may require the use of the 2024 Edition Reference Tables for Earth and Space Sciences.
Mount Morris Dam in Letchworth State Park
Letchworth Gorge is located southwest of Rochester, New York, where the Genesee River flows through the local landscape. It is sometimes referred to as the “Grand Canyon of the East” due to the height of its vertical face. The rock seen in the walls of the gorge consists primarily of shales and sandstones. These rocks formed during the Late Devonian Period. The Mount Morris Dam is located at the northern end of Letchworth Gorge.
Model of Rock Types for a Portion of Letchworth Gorge

(Not drawn to scale)
In the Letchworth Gorge, the Genesee River erodes sandstones and shale at different rates. Click the correct word to indicate which rock is more resistant to the effects of the Genesee River.
Support your choice with one piece of evidence from the model.
The photograph below shows the gorge in Letchworth State Park along the Genesee River. Two locations in the gorge are labeled X and Y.
Letchworth Gorge

Students in a class were tasked with identifying a new hiking route along the edge of the section of the Genesee River shown in the photo.
A student makes the claim below:
The safest route of the hiking trail should be near location ____ A ____ because at ____ B ____ there is a greater chance of weathering and erosion due to ____ C ____, which increases the risk of ____ D ____ along the trail.
Choices for:
A | B | C | D |
|---|---|---|---|
X or Y | X or Y | wind or gravity | flooding or landslides |
Which sequence of terms best completes the claim about the safest hiking route in Letchworth Gorge?
What are the constructive processes most likely responsible for the distribution of rock layers found in the Letchworth Gorge?
There are multiple stream monitoring stations located along the Genesee River and at the Mount Morris Dam to collect data on the level of the river.
The graph below shows some information about the Genesee River during a rain event.
Rain Event at Mount Morris Dam
Which statement identifies how the construction of the Mount Morris Dam has impacted the ability to control rain events?
Base your answers to questions 42 through 45 on the information below and on your knowledge of Earth and Space Sciences. Some questions may require the use of the 2024 Edition Reference Tables for Earth and Space Sciences.
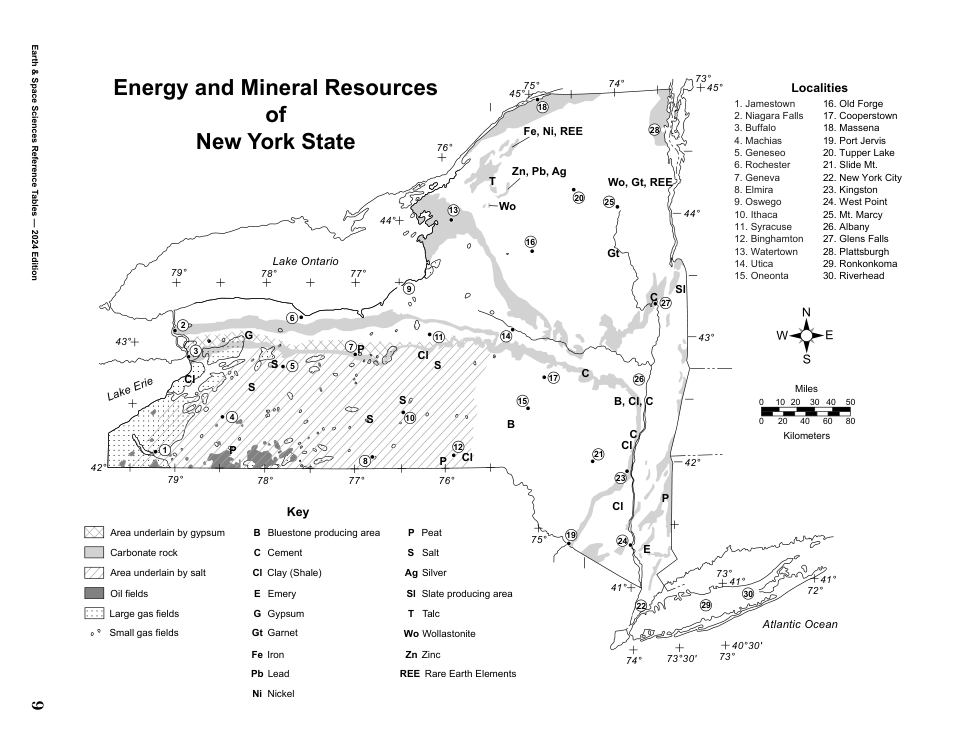
Energy and Mineral Resources
The shift toward renewable energy resources is growing worldwide. Mineral resources such as copper, nickel, zinc, and rare Earth minerals are important. They are critical to the production and distribution of traditional and renewable energy sources.
The United States imports more mineral resources than it produces. Other countries work toward similar clean energy transitions. The United States will be required to compete with other countries for these mineral resources.
The photograph below shows the open pit mine near Salt Lake City, Utah.
Kennecott Utah Copper Mine

The process of copper mining has environmental impacts on Earth systems. The model below shows some information about the steps involved in mining copper at and below Earth’s surface.
Model of Mining and its Potential Effects on the Environment
A student makes a claim that copper mines negatively affect Earth’s surface, causing a change to Earth’s systems. Identify the information in the model that provides evidence for a negative effect on Earth’s surface and a resulting change to one Earth system that supports this claim.
Negative effect:
Resulting change to one Earth system:
Over 50 kg of copper are used in the manufacture of most electric cars. Students researched information on the difference between gas-powered and electric cars. The information found is summarized below.
Comparison Between Gas-Powered and Electric Cars
Gas-Powered Car | Electric Car |
|---|---|
|
|
When comparing gas-powered cars to electric cars, which statement correctly summarizes the type of car that has a lower environmental impact related to the mining industry while providing reliable transportation for long distances?
Copper is an affordable and versatile metal. It is critical for economic development. The infographic below has information about the amount of copper mined on Earth through 2019 and the estimated copper reserves remaining on Earth.
Are We Running Out of Copper?
Which explanation uses evidence from the infographic to most correctly explain how human activity is being influenced by the availability of copper used in the manufacture of new electric vehicles?
Human populations have realized that there is a limited supply of traditional energy sources. For that reason, countries have been working on developing renewable energy sources. In 2020, renewable energy sources made up 21% of all electric generation resources in the United States.
The graph below shows some information about electric energy generation resources in the United States.
United States Energy Resources 2010-2050 (Projection)

Which evidence-based statement correctly describes how the electrical energy generation resources in the United States are projected to change as the demand for electricity increases?
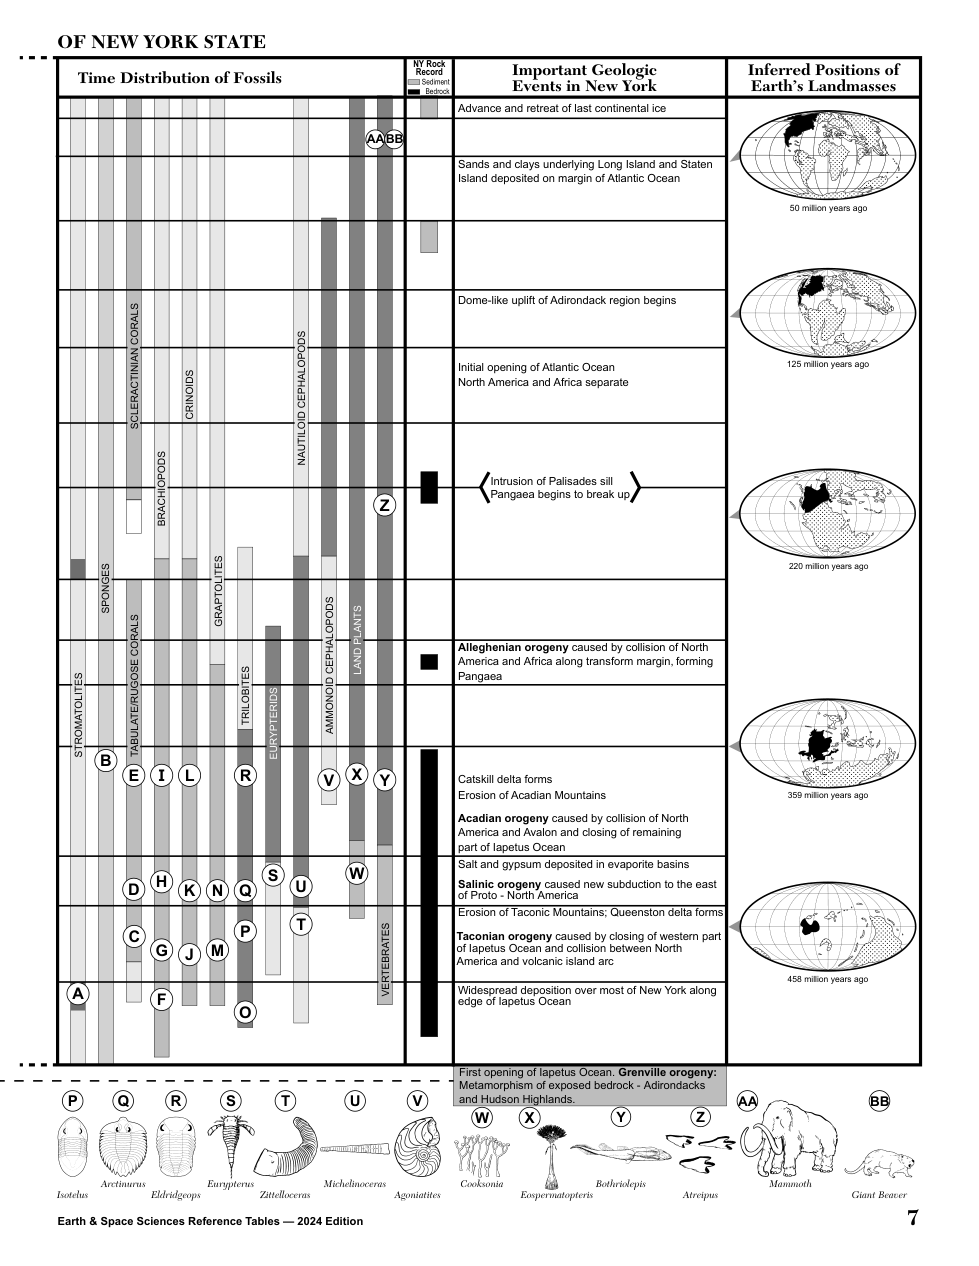
Base your answers to questions 46 through 50 on the information below and on your knowledge of Earth and Space Sciences. Some questions may require the use of the 2024 Edition Reference Tables for Earth and Space Sciences.
The Carboniferous Period
Plants became firmly established on land during the Carboniferous Period. Evidence of great forests and giant swamps have been found, dating to the latter part of the Carboniferous Period. This changed the concentration of atmospheric oxygen. It also resulted in a change to the concentration of atmospheric carbon dioxide. The graph below shows the changes in atmospheric gas concentrations over time.
Percent Concentration of Atmospheric Oxygen and Carbon Dioxide Over Time

Which claim accurately identifies a change in atmospheric oxygen levels due to a change in Earth’s biosphere in the Carboniferous Period?
Scientists claim Earth’s surface air temperature changed during the late Carboniferous Period. Analyze the data provided to support this claim by identifying the change to Earth’s atmospheric composition that would result in a temperature change. Also, describe this air temperature change.
Change in atmospheric composition:
Change in surface air temperature:
Students studying marine fossils from the early to the late Carboniferous Period noticed a substantial decrease in the number of fossilized marine species in rocks. While investigating this phenomenon, students considered several factors including sea level change, glaciation, and movement of tectonic plates. The graph shows information about sea level changes and changes in Pangea during the same time period.
Relative Sea-level Change Over the Last 550 Million Years

The students also analyzed information from maps of both the Early and Late Carboniferous Period.
Map of the Early Carboniferous: 340 Million Years Ago

Map of the Late Carboniferous: 310 Million Years Ago

Some Carboniferous rocks contain fossils of the dragonfly Meganeura, an extinct insect related to modern dragonflies.
Relative Size Comparisons for Modern Dragonflies and Carboniferous Dragonflies

The data table below compares the differences seen in modern dragonflies and Carboniferous Meganeura dragonflies due to differences in atmospheric gas concentrations.
Effect of Atmospheric Oxygen on Body Size of Dragonflies
Atmospheric Habitat | Largest Wingspan (cm) |
|---|---|
Modern Habitat (21% Atmospheric Oxygen) | 19.0 cm |
Carboniferous Habitat (31% Atmospheric Oxygen) | 65 cm |
Construct an argument that predicts the relative wingspan of a dragonfly if it were to have lived in the atmospheric conditions that existed 200 million years ago, compared to modern-day or Carboniferous Period dragonfly species.
The students summarized their research from the graph and the maps to make the claim: “A decrease of marine organisms from the early to the late Carboniferous Period is a result of sea level change and glaciation on Earth.”
Which pieces of evidence from the maps and graph support the students’ claim?
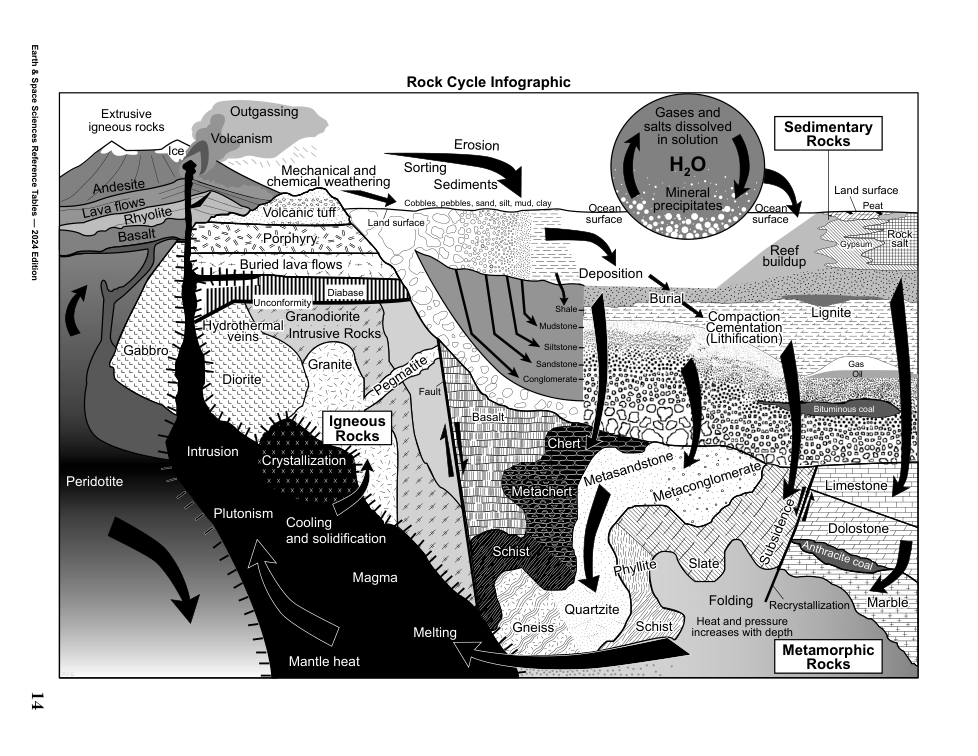
Carboniferous coal deposits can be found worldwide. Vegetation from Carboniferous forests accumulated in layers in large marshy areas. The biomass was buried and became layers of peat. The model below shows some information about how coal forms.
Formation of Coal Model

The cycling of carbon through Earth’s spheres results in different stages of coal formation. Which piece of evidence could support the claim that environments of early coal formation can be found in New York State?
Statement 2:
Cosmic microwave background radiation is able to be detected because the universe
Statement 3:
Cosmic microwave background radiation variations in the universe, caused by density differences, indicate that
Statement 2:
One cause of the global circulation patterns of ocean currents is the
Statement 3:
Other than ocean currents, global patterns that contributed to the distribution of the toys were also influenced by atmospheric