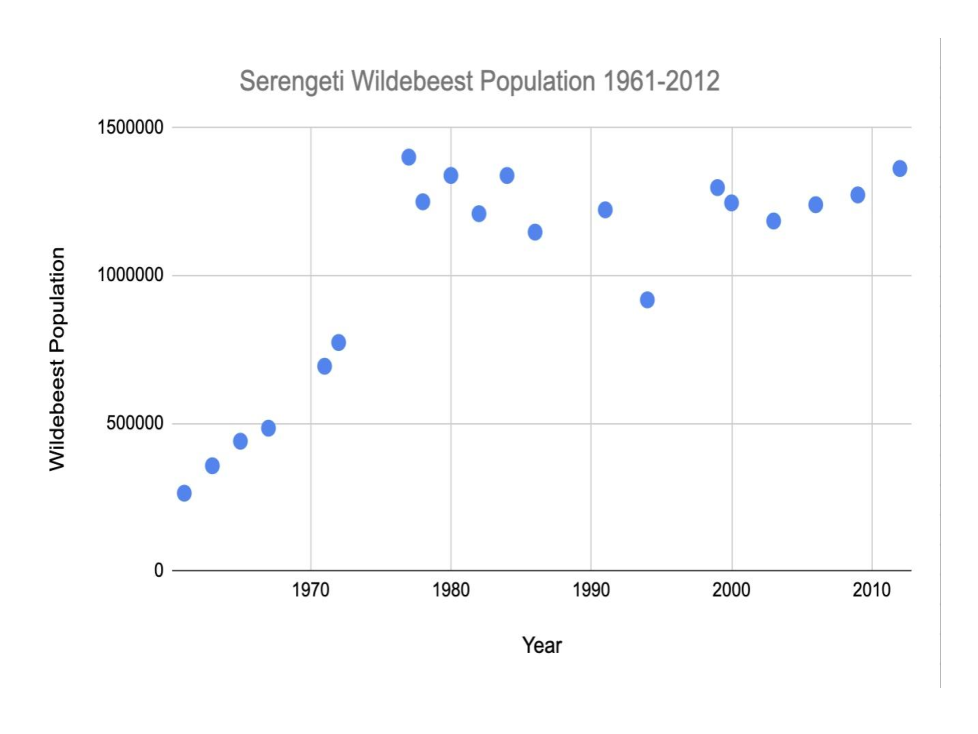
2. Wildebeest Population Data
star
star
star
star
star
Posljednje ažuriranje about 2 years ago
13
1
1
1
1
Describe how the historical data compares to the data you collected during the simulation.
Use this information and the graph above to explain what happened to the wildebeest population between 1960 and 1977.
Look at the wildebeest population from 1977-1978. Describe what happened to the wildebeest population between 1977 and 1978.
Look at the wildebeest population from 1978 and 2004. Describe what happened to the wildebeest population between 1978 and 2004.
Using what you know about limiting factors, explain why the population changed from 1961 to 1977
Using what you know about limiting factors, explain why the population changed from 1977 to 1978
Using what you know about limiting factors, explain why the population changed from 1978 to 2004
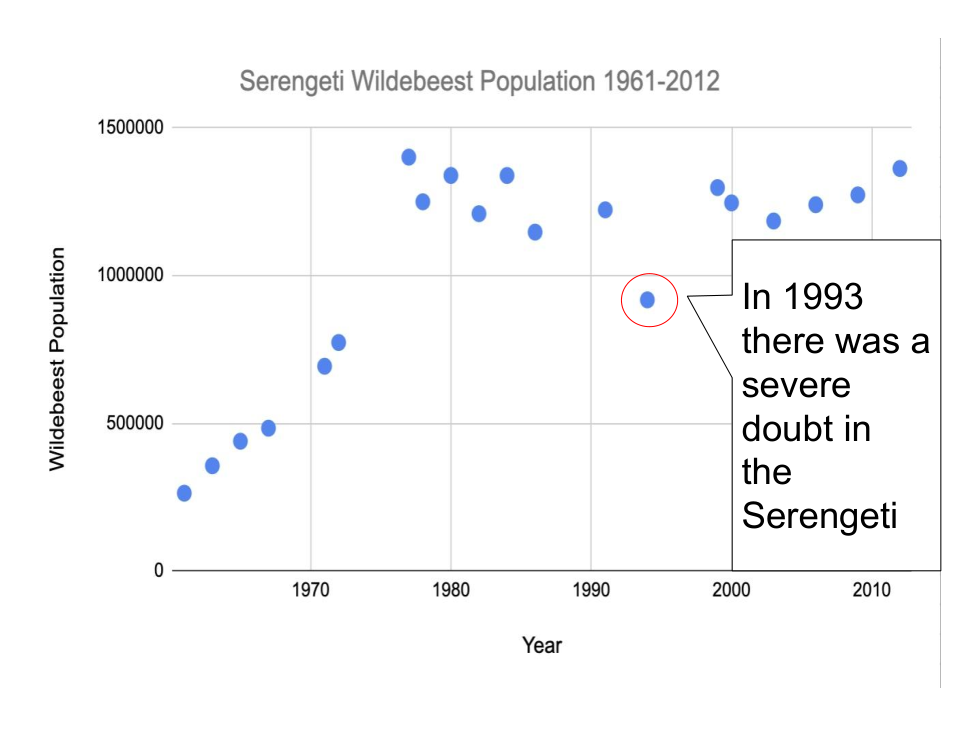
In 1993, there was a severe drought in the Serengeti. What happened to the wildebeest population during the drought? Use evidence from the graph to support your answer.
Wildebeest population data was not available for 1995 to 1998. When do you think the drought ended?
If conditions in the Serengeti remain constant, what do you predict would happen to the wildebeest population in the next 20 years?
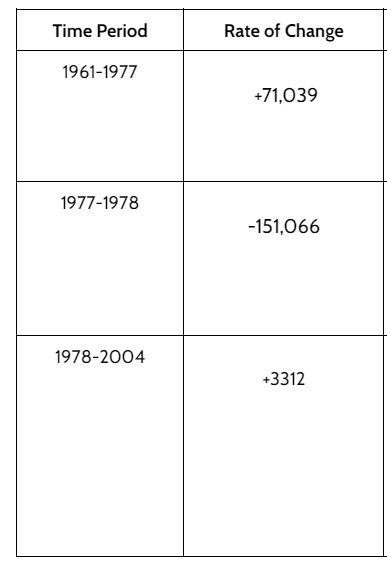
According to the rate of change from 1977 to 1978, the wildebeest population
According to the rate of change from 1978 to 2004, the wildebeest population
What do the rates of change tell you about the effects of limiting factors on the wildebeest population?