1
1
1
1
1
1
Go back to the home button and type in Nantucket, MA. How healthy is Nantucket?
Look at the county snapshot (the big table). Identify two measures where Nantucket seems to be performing well.
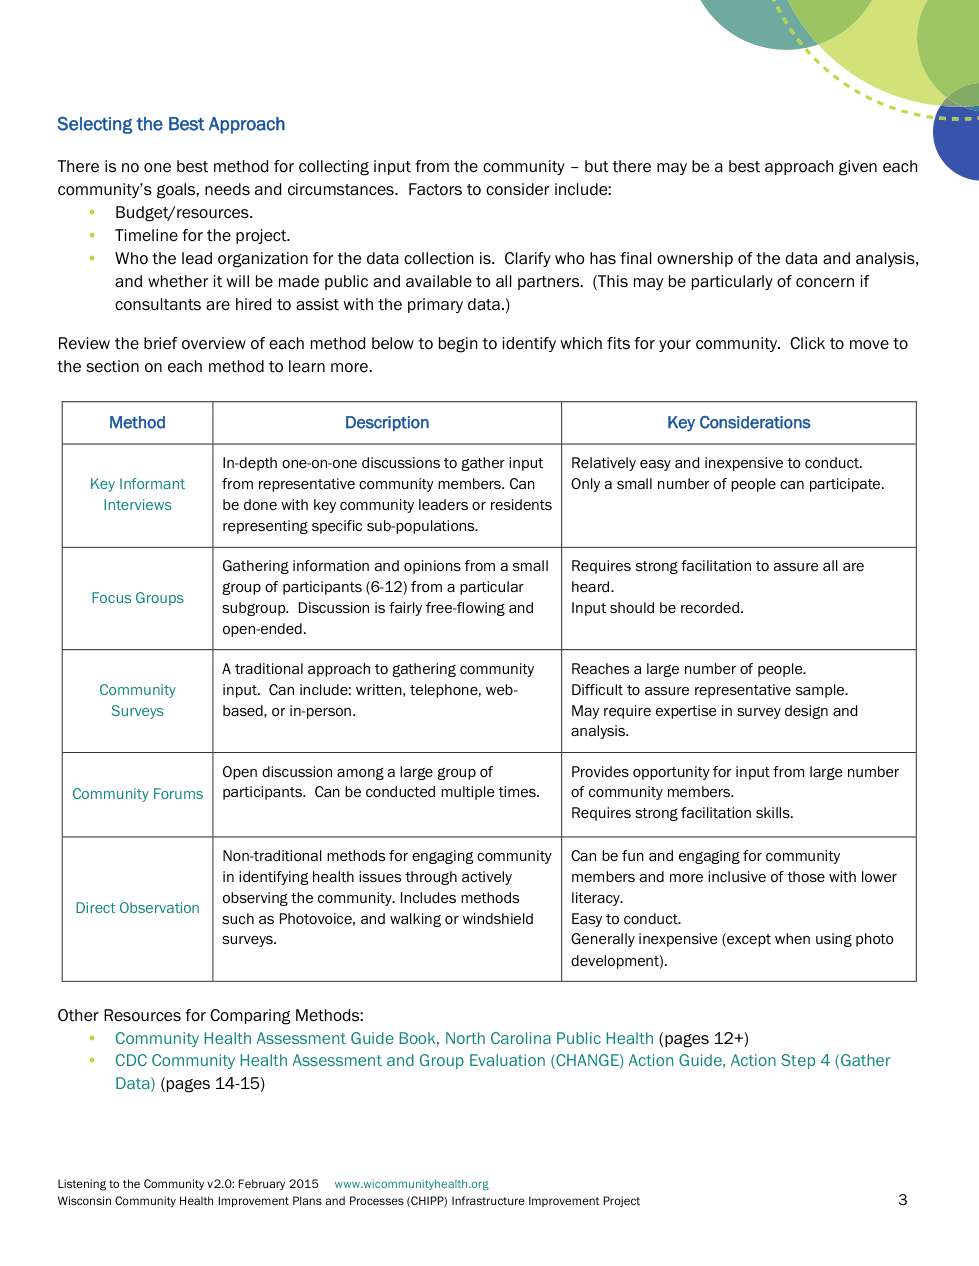
What is an advantage of key informant interviews (hint: look under key considerations)
What method uses small groups to gather information?
Go to the Find More Data Webpage.
https://www.countyhealthrankings.org/explore-health-rankings/data-beyond-the-rankings
Scroll down the page to National Data Sources. How many sources are included?
How many sources provide data broken down by demographics (age, sex, race/ethnicity?)
How many sources provide data for sub-county geographic units (ex. cities, zip codes or school districts)?
What is one piece of data you can learn about on this website?
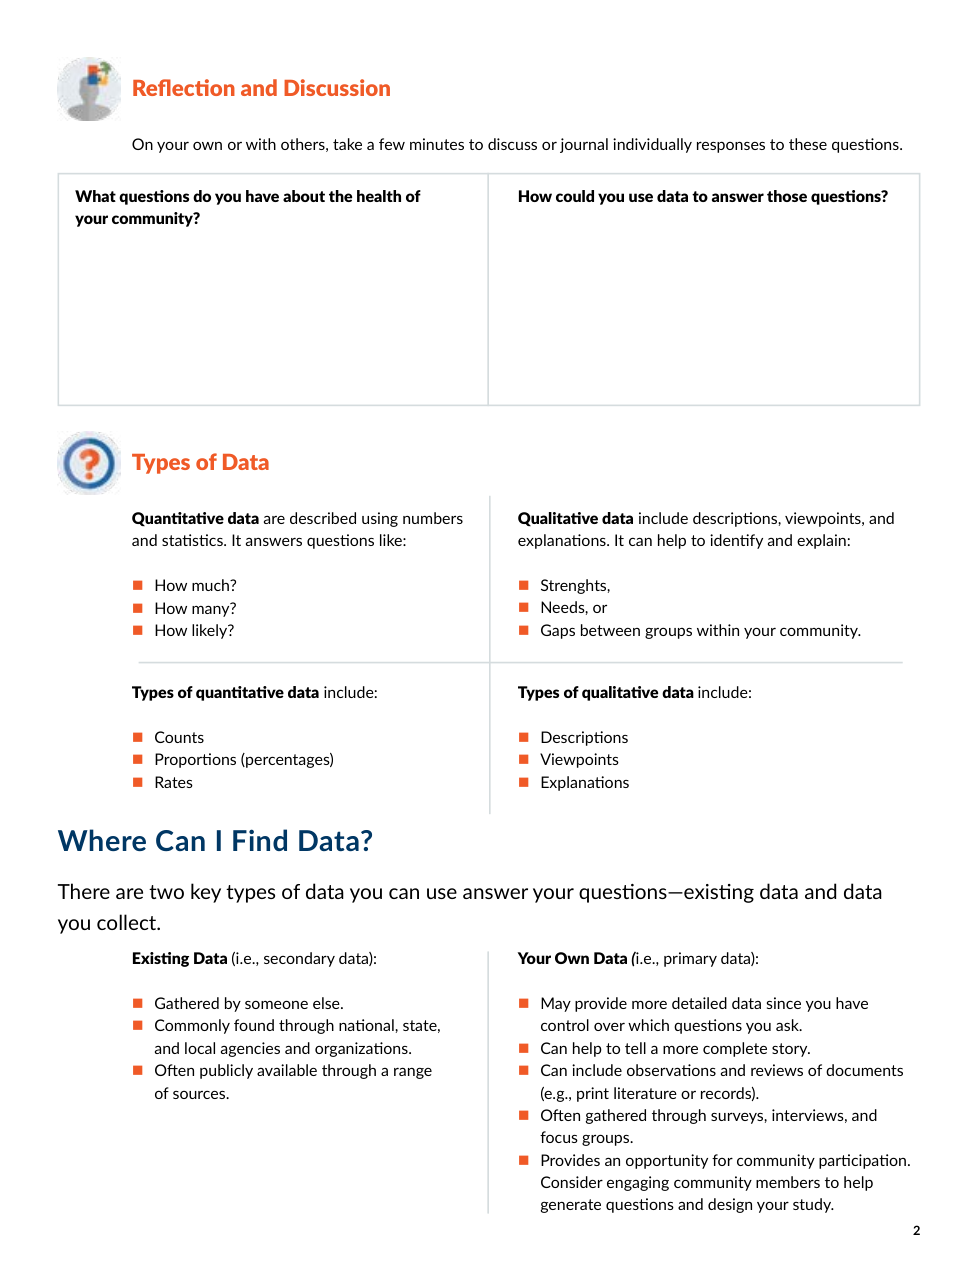
What type of data uses numbers and can answer questions like how much?
What type of data includes descriptions and viewpoints?
Click on the words that describe types of quantitative data.
Click on the words that describe types of qualitative data.
What type of data is gathered by someone else and commonly found through national agencies?
What type of data is collected by you the researcher?
What method uses a traditional approach to gathering community input through written, telephone, web based or in person surveys.
What method uses an open discussion among a large group of participants
How healthy is your county in Massachusetts?
Is the county's health outcome and factor what you expected? Explain.
Look at the county snapshot (the big table). Identify two measures where Bristol county seems to be performing well.
Look at the county snapshot (the big table). Identify two measures where Bristol county has room to improve.
Notice that different types of quantitative data are represented in the table. State a measure that uses percentage.
Notice that different types of quantitative data are represented in the table. State a measure that uses ratio.
Notice that different types of quantitative data are represented in the table. State a measure that uses means.
Scroll to Children in Poverty under Social and Economic Factors.
What percentage of children live in poverty in Bristol County?
If you click on Children in poverty you will be able to see the dat broken down by race/ethnicity. How does the Children in Poverty vary by race/ethnicity?
Click on the methods and limitations. What is the data source for child poverty?
What questions does your snapshot raise for you about what's impacting your community?