Week 1 Graph of the Week
star
star
star
star
star
Last updated almost 3 years ago
9 Nsɛmmisa
Hyɛ no nsow a efi ɔkyerɛwfo no hɔ:
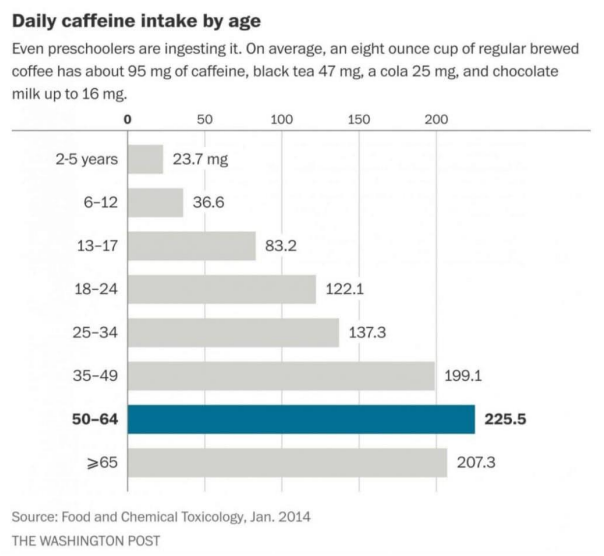
Analyze the graph below to answer the questions on the right. Graphs will be presented on Monday and due BEFORE class on Friday of that week. On Friday we will have a class discussion about the graph. Graph of the Weeks completed after the discussion will be considered late and graded with a maximum grade of 70%. The last two questions are not graded, but will be beneficial to have for the discussion. The quality of discussions will determine how intricate future graph of the weeks are. Good discussions will continue with multiple choice questions. Poor discussions will begin having graded extended response questions.
Analyze the graph below to answer the questions on the right. Graphs will be presented on Monday and due BEFORE class on Friday of that week. On Friday we will have a class discussion about the graph. Graph of the Weeks completed after the discussion will be considered late and graded with a maximum grade of 70%. The last two questions are not graded, but will be beneficial to have for the discussion. The quality of discussions will determine how intricate future graph of the weeks are. Good discussions will continue with multiple choice questions. Poor discussions will begin having graded extended response questions.
What other observations could you make about this graph? Try to think of high quality observations, not just 'the graph has color'.
What is the topic of this graph?
What variable is on the x-axis?
What variable is on the y-axis?
What other variables are being compared on this graph? Select all that apply.
What is the independent variable?
What is the dependent variable?
Which of the following would be an accurate observation based on the data presented on this graph?
Make a prediction about how this data might change in the next 10 years.