Twa kɔ nsɛm atitiriw so
Log in
Sign up for FREE
arrow_back
Laabri

2.16 Unit 2 Test

star
star
star
star
star
Last updated about 1 month ago
18 Nsɛmmisa

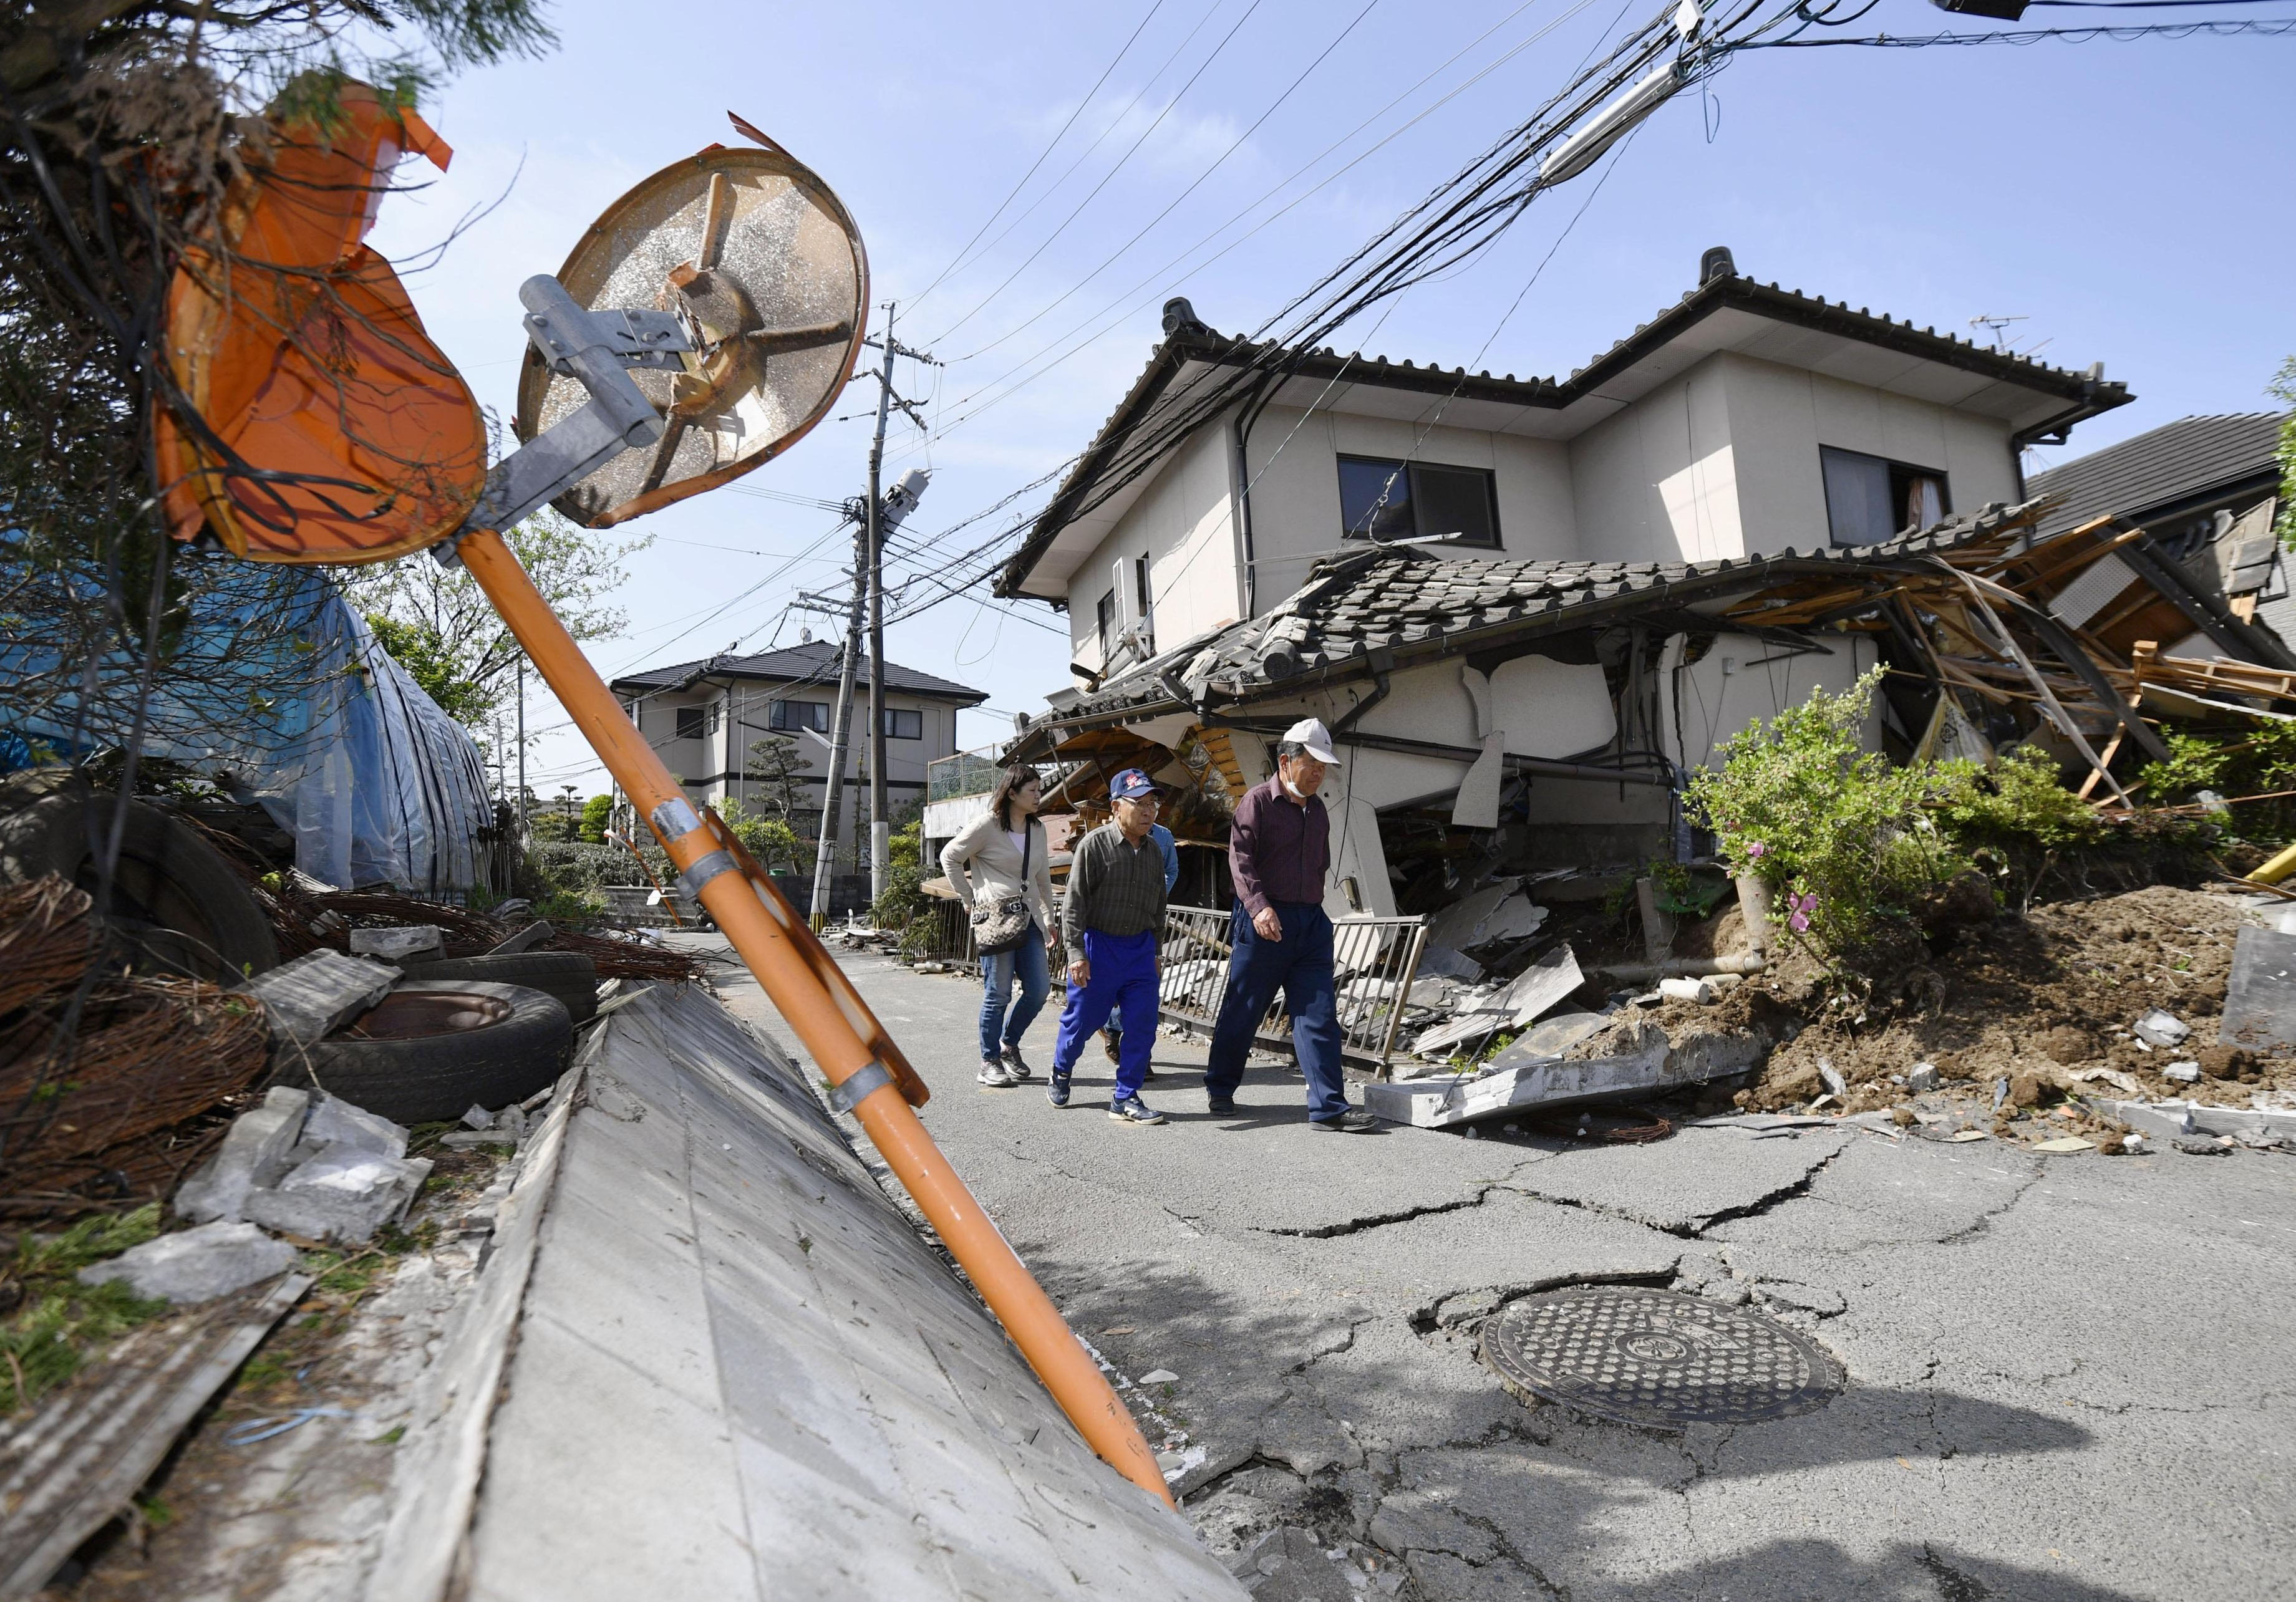
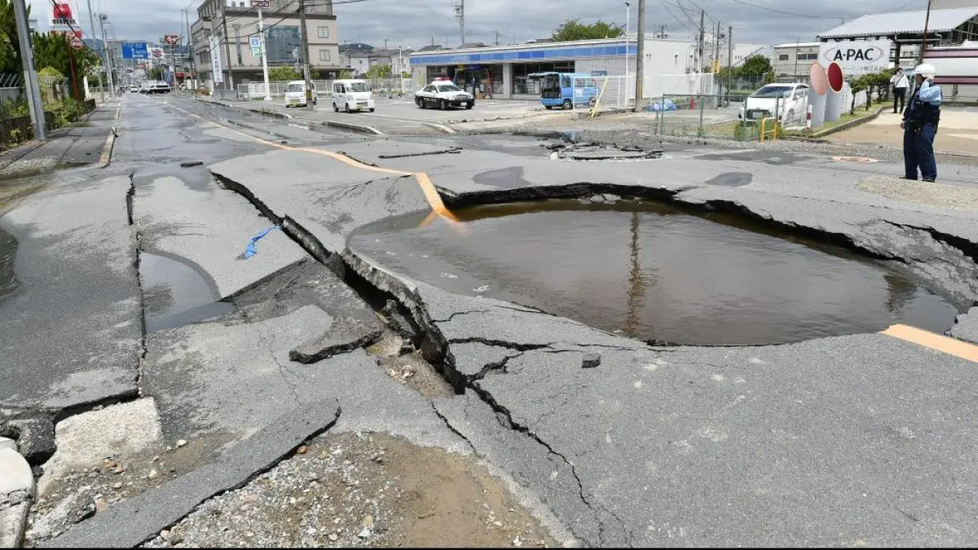
You are vacationing in Tokyo, Japan when you feel the ground begin to move. At first you think you are imagining it, then it gets stronger, you can see the buildings swaying and people running. Its been 30 seconds and the earthquake is still raging. You start to notice the ground rolling beneath you and run into a clearing, far from buildings and large trees. You watch as debris falls and the ground forms small cracks and try to keep your balance. The roads begin to buckle and some buildings crumble, until finally the movement stops and silence falls. You gaze upon the damage, stunned by what just happened.
Ɛhia
5
HS-ESS1-5
HS-ESS2-1
2
HS-ESS1-5
HS-ESS1-6
+2
Ɛhia
2
HS-ESS1-5
HS-ESS2-3
Ɛhia
5
HS-ESS1-5
HS-ESS2-1
HS-ESS2-3

Now that the earthquake has stopped, questions start running through your head. What happend, why and how. Where did this earthquake come from? Not long after the quake, the local news station releases seismograph data from locations around Japan.

Ɛhia
2
HS-ESS1-5
HS-ESS2-1
Ɛhia
5
HS-ESS1-5
HS-ESS2-1
Ɛhia
2
HS-ESS1-5
HS-ESS2-1
Ɛhia
2
HS-ESS1-5
HS-ESS2-1

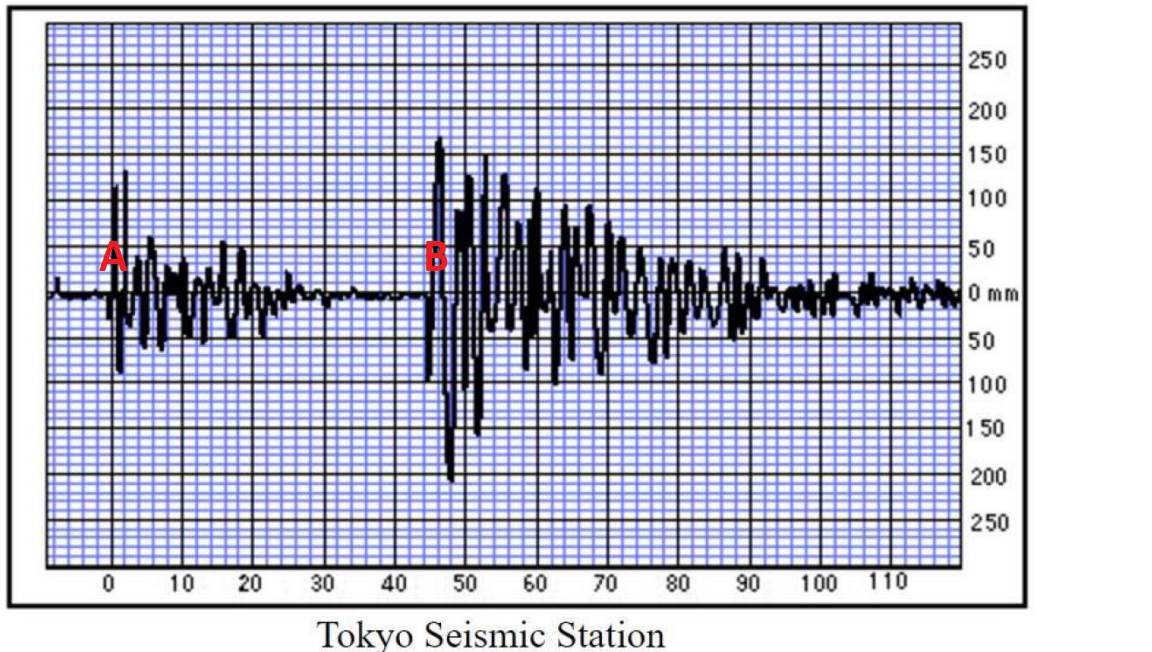
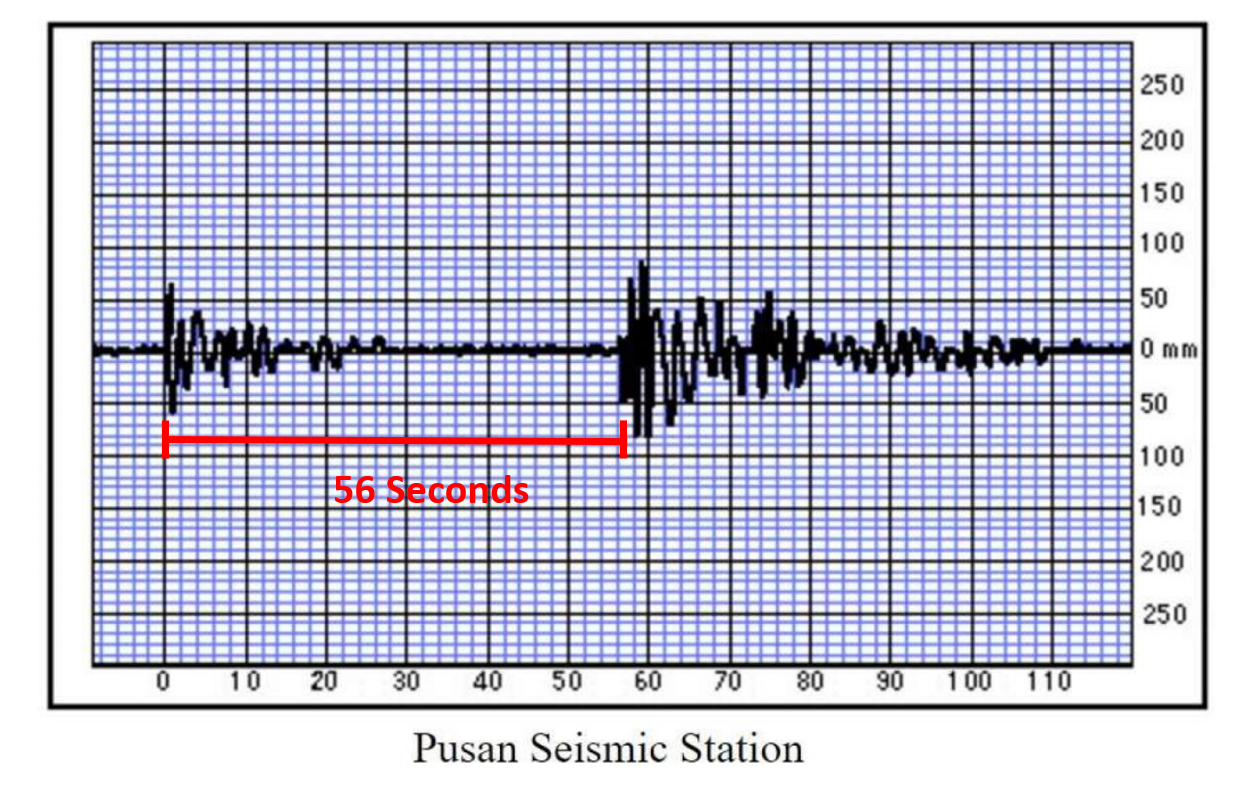
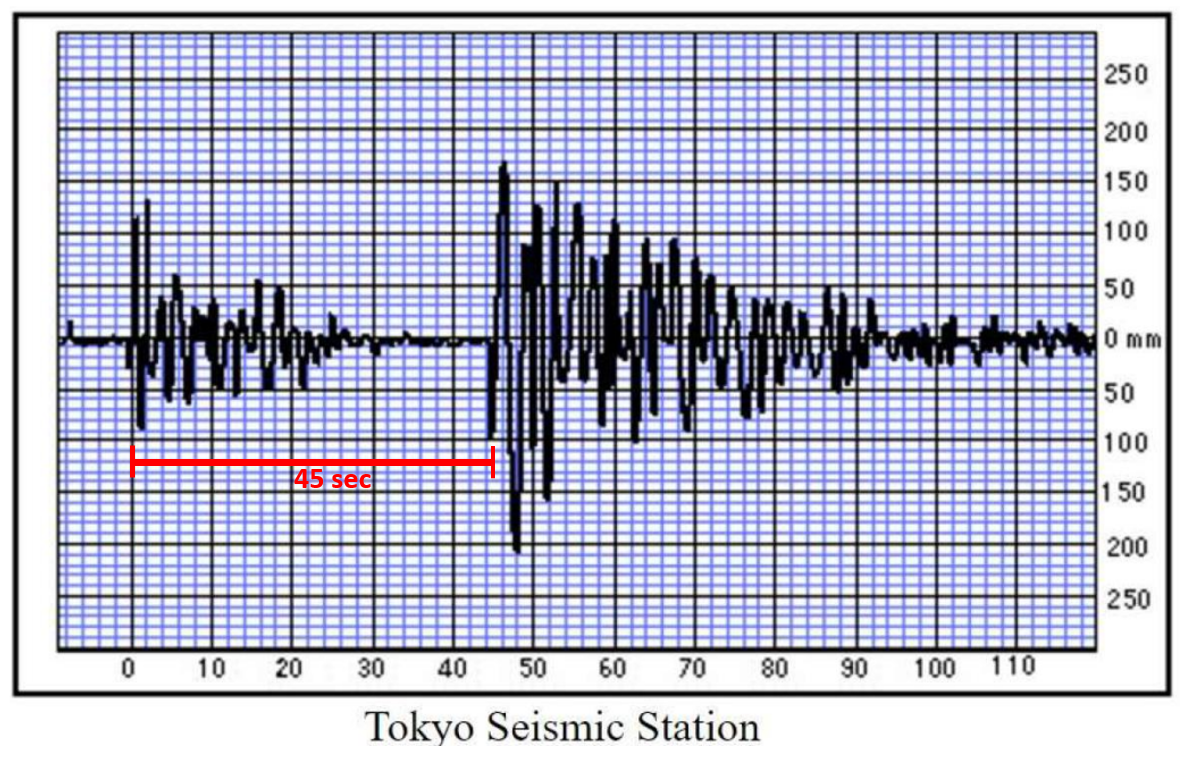
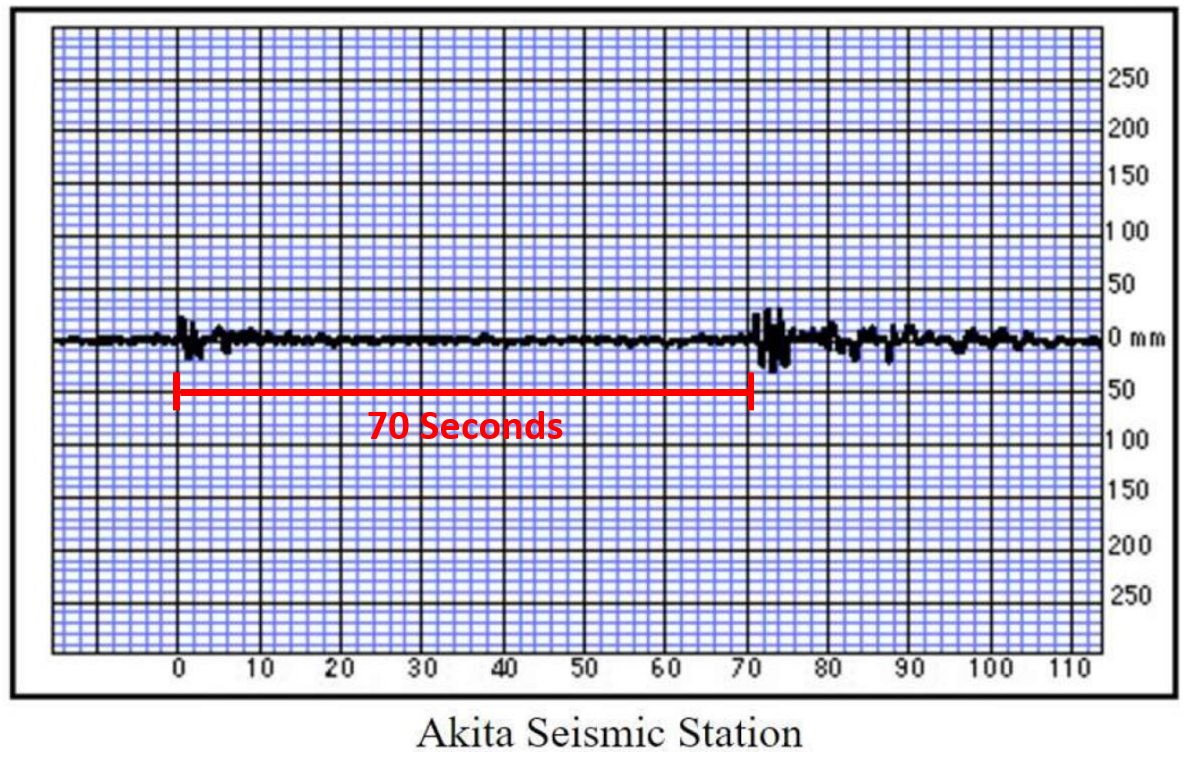
You have seismograph data from three locations, use the seismograph information below to find your time intervals for each location.

Location #1 Pusan, South Korea

Location #2 Tokyo, Japan

Location #3 Akita, Japan

Ɛhia
3
Asemmisa {{asɛmmisaAhyɛnsode}}
9.

Fill in the blanks below with the time interval for each location. (The time interval is provided on the seismograph data, click on each image to enlarge it)

(answer with number +s, i.e. 36 s)

Location Time Between Waves (s)

Pusan, South Korea

Tokyo, Japan

Akita, Japan

HS-ESS1-5
HS-ESS2-1
HS-ESS2-3

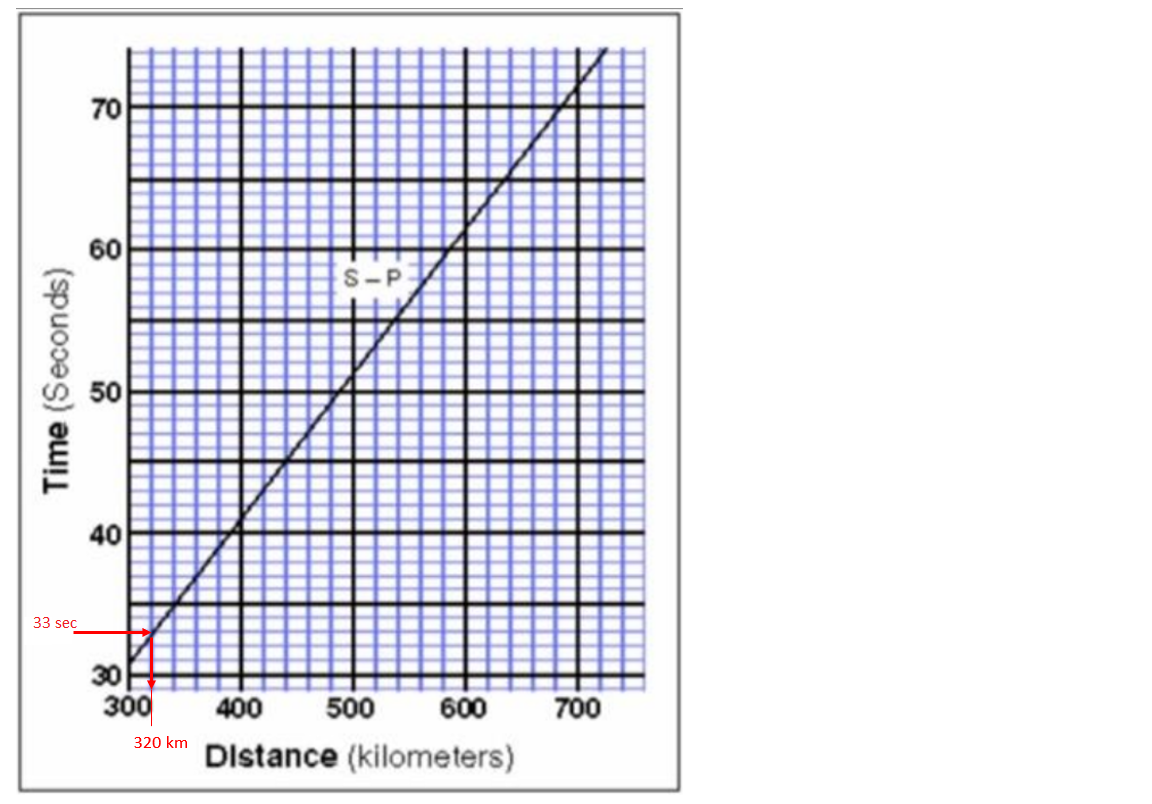
Now that you have the times for each location, use the chart provided to convert the time between the P-Wave and S-wave into distance.

This can be done because the waves move through the earth at different rates, and the further away from the epicenter you are the larger the time difference between the waves.

1) Click to enlarge the graph

2) Find your time on the Y axis.

3) Follow that horizontally until you reach the diagonal line.

4) follow the line vertically down to the X axis to find your distance.

Each line on the vertical axis represents 1 second.

Each line on the horizontal axis represents 20 km.

Hint: This is the same process we did in the 2.10 Earthquake Epicenter Assignment.

Use the graph to the left (Click on it to enlarge) to convert your times into distance from the epicenter for each location.

Find your time on the Y axis, follow it horizontaly until you reach the diaginal line, then follow it straight down to the distance.

For example, if our time between the P-Wave and S-Wave was 36 seconds, our distance from the epicenter would be 320 KM.

(This is the same process we used in the Earthquake Epicenter assignment).

Ɛhia
3
Asemmisa {{asɛmmisaAhyɛnsode}}
10.

Type your distances into the correct space.

(Answer with distance + km, i.e 320 km)

Location Distance (km)

Pusan, South Korea

Tokyo, Japan

Akita, Japan

HS-ESS1-5
HS-ESS2-1
HS-ESS2-3

The distances you have found are from the epicenter to the seismograph location, or the radius of the circle around each city. In order to map your data, you need the diameter of the circle around each city.

Ɛhia
3
Asemmisa {{asɛmmisaAhyɛnsode}}
11.

Multiply each distance by 2 to get the diameter.

(Answer with number + km, i.e 640 km)

Location Circle Diameter (km)

Pusan, South Korea

Tokyo, Japan

Akita, Japan

HS-ESS1-5
HS-ESS2-1
HS-ESS2-3

You are so close to finding out where this earthquake originated from. Now you need to map out your data to triangulate the epicetner location.

1) Use the circle tool and the scale at the bottom of the map to draw a circle that is the size of the diameter.

Circle tool:

2) Use the select tool to move the circle so that the correct city is in the center of the circle.

Select tool:

Do this for all 3 cities.

3) Look for a point where all 3 circles overlap. Use the scribble tool and pick a color to mark your epicenter.

Scribble Tool:

(This is the same process we used in 2.13 Earthquake Epicenter Activity)

Ɛhia
5
Asemmisa {{asɛmmisaAhyɛnsode}}
12.

Map your data and mark the epicenter location.

HS-ESS1-5
HS-ESS2-1
HS-ESS2-3
Ɛhia
2
HS-ESS1-5
HS-ESS2-1
Ɛhia
2
HS-ESS1-5
HS-ESS2-1
Ɛhia
2
HS-ESS1-5
HS-ESS2-1
Ɛhia
2
HS-ESS1-5
HS-ESS2-1
Ɛhia
5
HS-ESS1-5
HS-ESS2-2
Ɛhia
4
HS-ESS1-5
HS-ESS2-2
Asemmisa {{asɛmmisaAhyɛnsode}}
1.

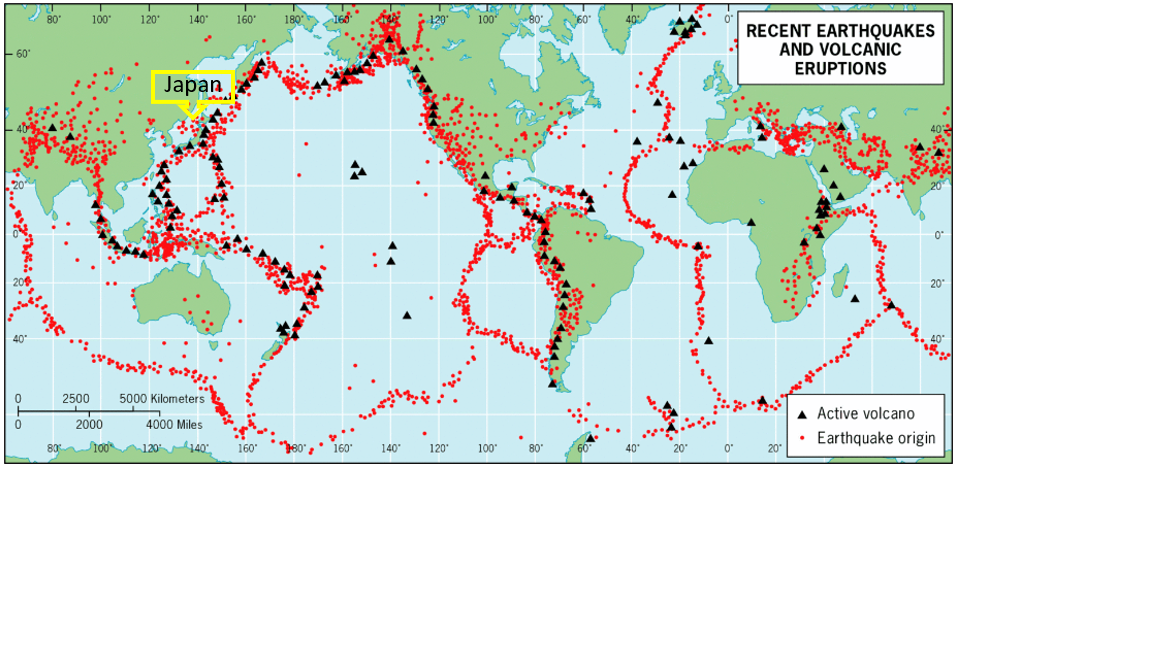
Looking at this map of world wide earthquakes and volcanoes, What do you notice? What do the lines of volcanoes and Earthquakes map out?

Asemmisa {{asɛmmisaAhyɛnsode}}
2.

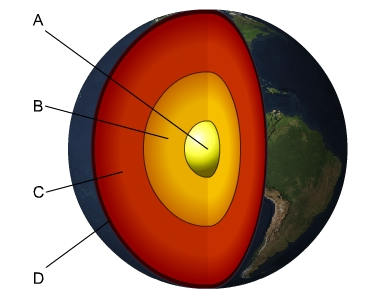
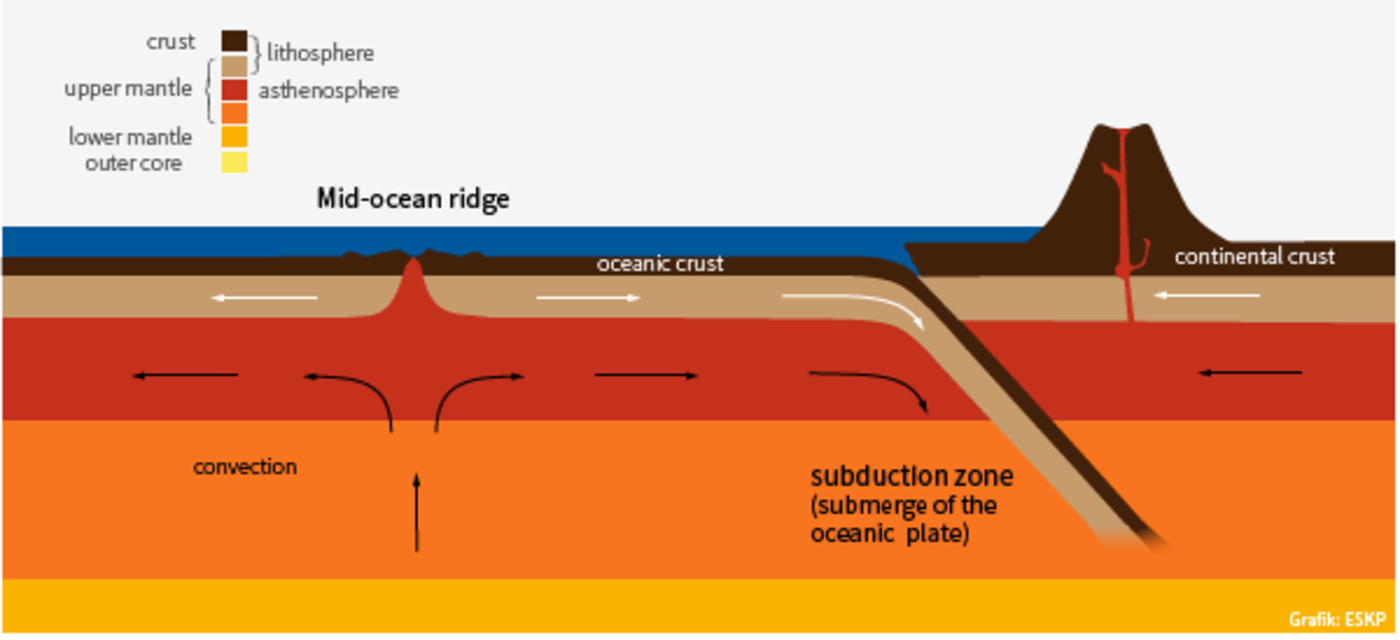
In the diagram of the Earth's Interior, which part drives the movement of the plates?

Asemmisa {{asɛmmisaAhyɛnsode}}
3.

What process occurs within the Earth that causes the plates to move?

Asemmisa {{asɛmmisaAhyɛnsode}}
4.

Find Japan on this map, What does the map tell you about this location in relation to earthquakes and volcanoes?

Asemmisa {{asɛmmisaAhyɛnsode}}
5.

What is a Seismograph?

Asemmisa {{asɛmmisaAhyɛnsode}}
6.

How can you use seismograph data to learn more about an earthquake (other than force and duration)?

Asemmisa {{asɛmmisaAhyɛnsode}}
7.

In the image above, which wave is the P-Wave?

Asemmisa {{asɛmmisaAhyɛnsode}}
8.

What do P-Wave and S-Wave stand for?

NOTE: You must complete #9-12 in order to earn credit for #13-17.

You now know where the earthquake came from, but why did it happen? What caused the earth to move so violently?

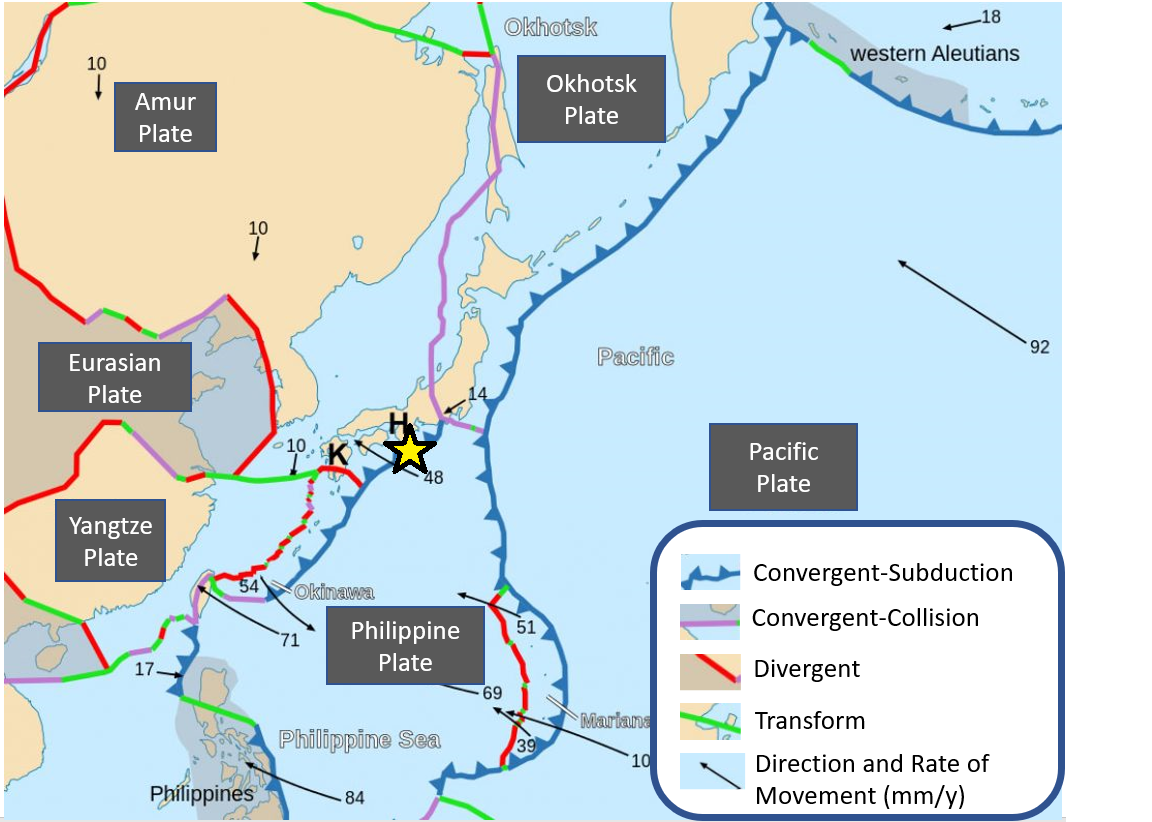
Take a look at this map of Plate Boundaries in the Japan Region and answer the following questions.

click on the map to zoom in.

Asemmisa {{asɛmmisaAhyɛnsode}}
13.

Look at the map. What 2 plates are interacting at the location of the epicenter?

Make sure to read the plate labels carefully.

Asemmisa {{asɛmmisaAhyɛnsode}}
14.

Use the Key on the map to identify the type of plate boundary the epicenter is on.

Asemmisa {{asɛmmisaAhyɛnsode}}
15.

What type of movement is happening on this boundary?

Asemmisa {{asɛmmisaAhyɛnsode}}
16.

What type of geologic feature would you expect on this boundary?

Asemmisa {{asɛmmisaAhyɛnsode}}
17.

An Oceanic Plate is subducting on it's eastern side, what is the most likely boundary type on the western side of the plate?

Asemmisa {{asɛmmisaAhyɛnsode}}
18.

Match the type of boundary with the correct plate movement.

Draggable itemarrow_right_altCorresponding Item

Convergent Subduction

arrow_right_alt

Plates moving away from each other, forming a spreading center ridge.

Transform

arrow_right_alt

Where one plate slides under the other, forming a trench and volcanic mountain ranges.

Divergent

arrow_right_alt

Where the plates smash into each other and rise up into a mountain range.

Convergent Collision

arrow_right_alt

Two plates sliding against each other, either horizontally or vertically, forming large fault lines.