Log in
Sign up for FREE
arrow_back
Library

2.10 Earthquake Epicenter Lab

star
star
star
star
star
Last updated about 3 hours ago
6 questions
Note from the author:
Required
0
Required
5
HS-ESS2-1
HS-ESS2-3
Required
5
HS-ESS2-1
HS-ESS2-3
Required
10
HS-ESS2-1
HS-ESS2-3
Required
0
Required
0

If you need help, please watch the class recording

Learning Target: Identify where earthquakes occur using P-waves, S-waves, and surface waves

Success Criteria: Identify the location of an earthquake

If you need help, please watch the class recording

Learning Target: Identify where earthquakes occur using P-waves, S-waves, and surface waves

Success Criteria: Identify the location of an earthquake

Question 1
1.

Pre-Lab: Why would it be important for scientists to identify the location of an earthquake? How could they use this knowledge in the future?

In order to determine the epicenter of an earthquake, scientists need data from 3 seismograph stations. Seismographs record P waves, S waves, and surface waves.

By looking at the difference in time between the arrival of the P and S waves, scientists can determine how far away the epicenter of the earthquake is from the seismograph station.

Consider this sample data from Tulsa, OK:
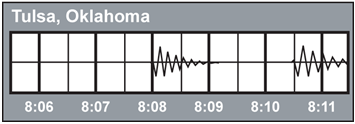

The first activity is the P waves. The second activity is the S waves. Each box on the seismograph represents 30 seconds.

The beginning of the P waves and beginning of the S waves are 5 boxes apart, which would be 2 minutes and 30 seconds.

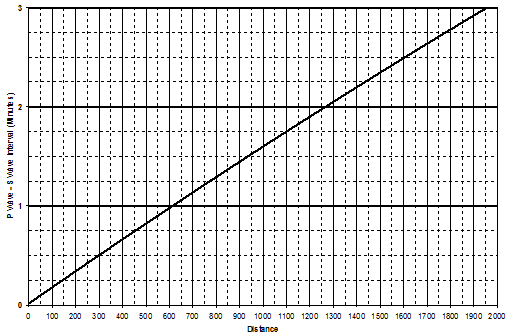
Knowing the S-P wave interval, we can then use this chart to determine how far away the earthquake's epicenter is:
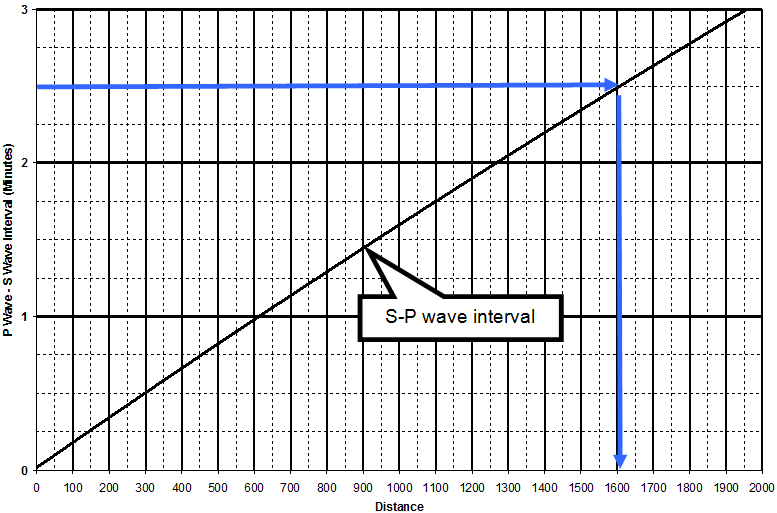
By finding 2 minutes and 30 seconds on the vertical (y axis), we can find where that falls on the S-P wave interval. Then, we can find where that falls on the horizontal (x axis) to determine the distance from the epicenter.

In this case, Tulsa was 1600 km from the epicenter.
Question 2
2.
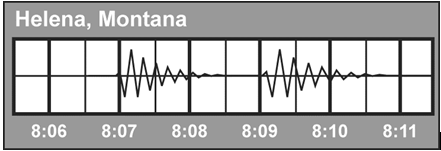
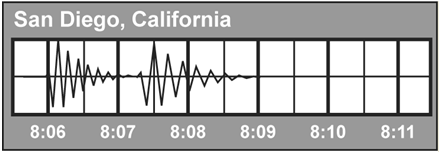
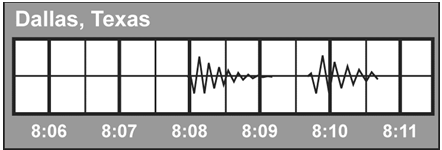
Examine the data from 3 seismograph stations to determine the interval between P and S wave arrival and complete the table. Use the form MM:SS (minutes: seconds)

For example 5 minutes and 15 seconds would be, 5m 15s.

Round to the nearest 15 seconds.

Location Difference Between the P and S Wave Arrival Times (M:SS)
Dallas, TX _______
Helena, MT _______
San Diego, CA _______
Now use the P-S Interval Chart to determine the distance between the seismograph and the epicenter and complete the table below.


Question 3
3.
Write your distance from the epicenter to each location, below. This is your radius of the circle around each location.

Please format your answer with the number km.

For example 3450 km.

Location Distance from Epicenter (km)
Dallas, TX _______
Helena, MT _______
San Diego, CA _______
Question 4
4.

Question 5
5.

Question 6
6.

Bonus Science about subduction zones!
Add circles to the map to triangulate the location of the earthquake.

1) convert your radius distance to diameter (radius X2=diameter)

2) Use the circle tool and the scale at the bottom of the map to draw a circle that is the size of the diameter.
Circle tool:


3) Use the select tool to move the circle so that the correct city is in the center of the circle.
Select tool:


Do this for all 3 cities.

Look for a point where all 3 circle overlap. Mark this as the epicenter of the earthquake.

Check out thehelp video to see how to place your circles on the map below.
Please rate yourself on your understanding of the learning target: Identify where earthquakes occur using P-waves and S-waves.
😄 I can do this!
👌 I'm getting there!
🙈 I need help!
Please rate yourself on your achievement of the success criteria: Identify the location of an earthquake
😄 I successfully located the earthquake!
👌 I think I found the earthquake
🙈 I have no idea where the earthquake happened