Module 1&2 Sept #1-20
star
star
star
star
star
Last updated almost 3 years ago
20 Nsɛmmisa

1
1
One of these 80 students is selected at random. What is the probability that this child went to London?
Summarize categorical data for two categories in two-way frequency tables. Interpret relative frequencies in the context of the data
Complete the table. Then, Verbally and orally, state the meaning of each value
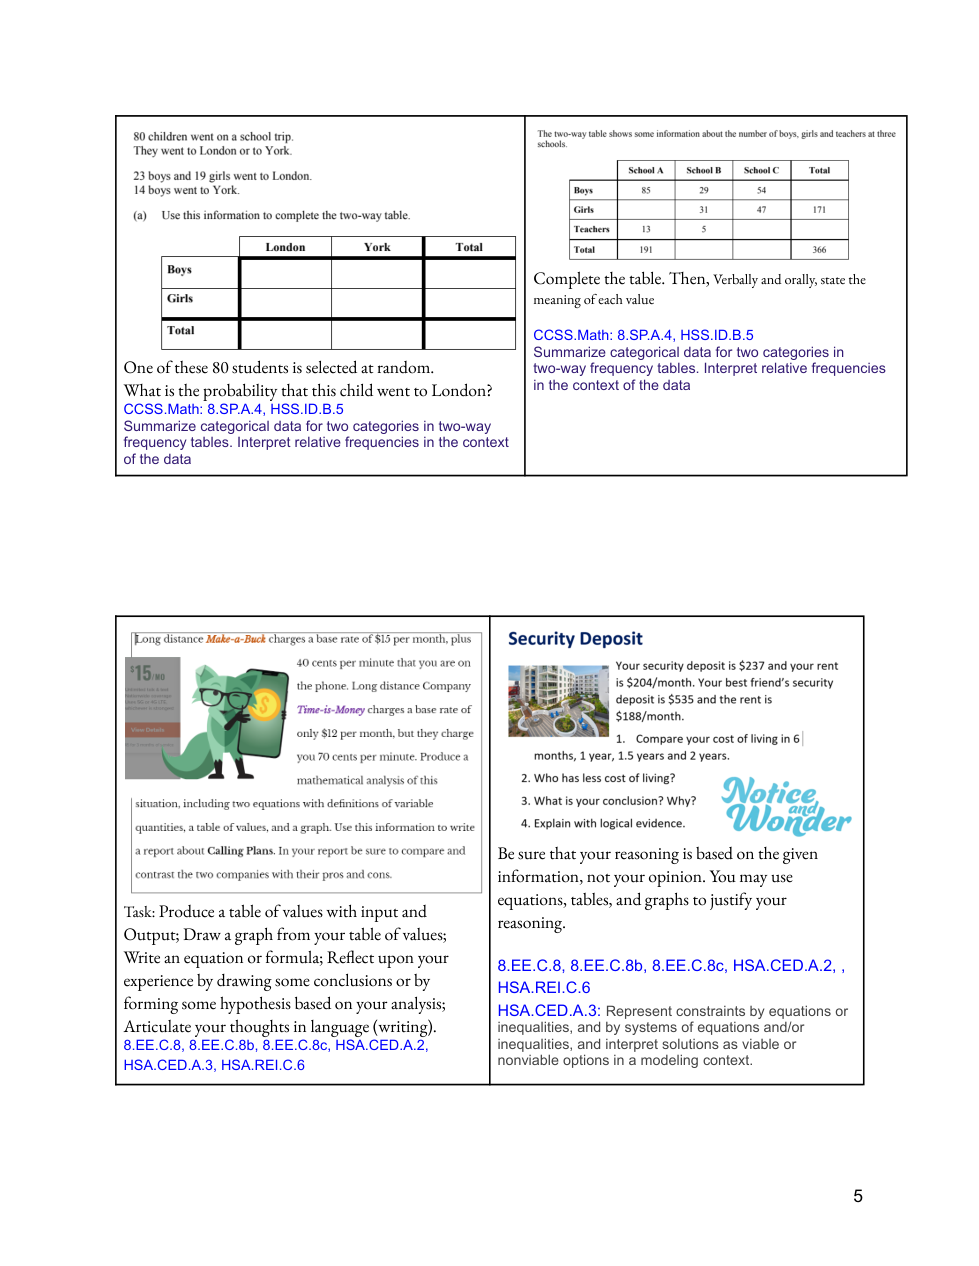
Task: Produce a table of values with input and Output; Draw a graph from your table of values; Write an equation or formula; Reflect upon your experience by drawing some conclusions or by forming some hypothesis based on your analysis; Articulate your thoughts in language (writing).
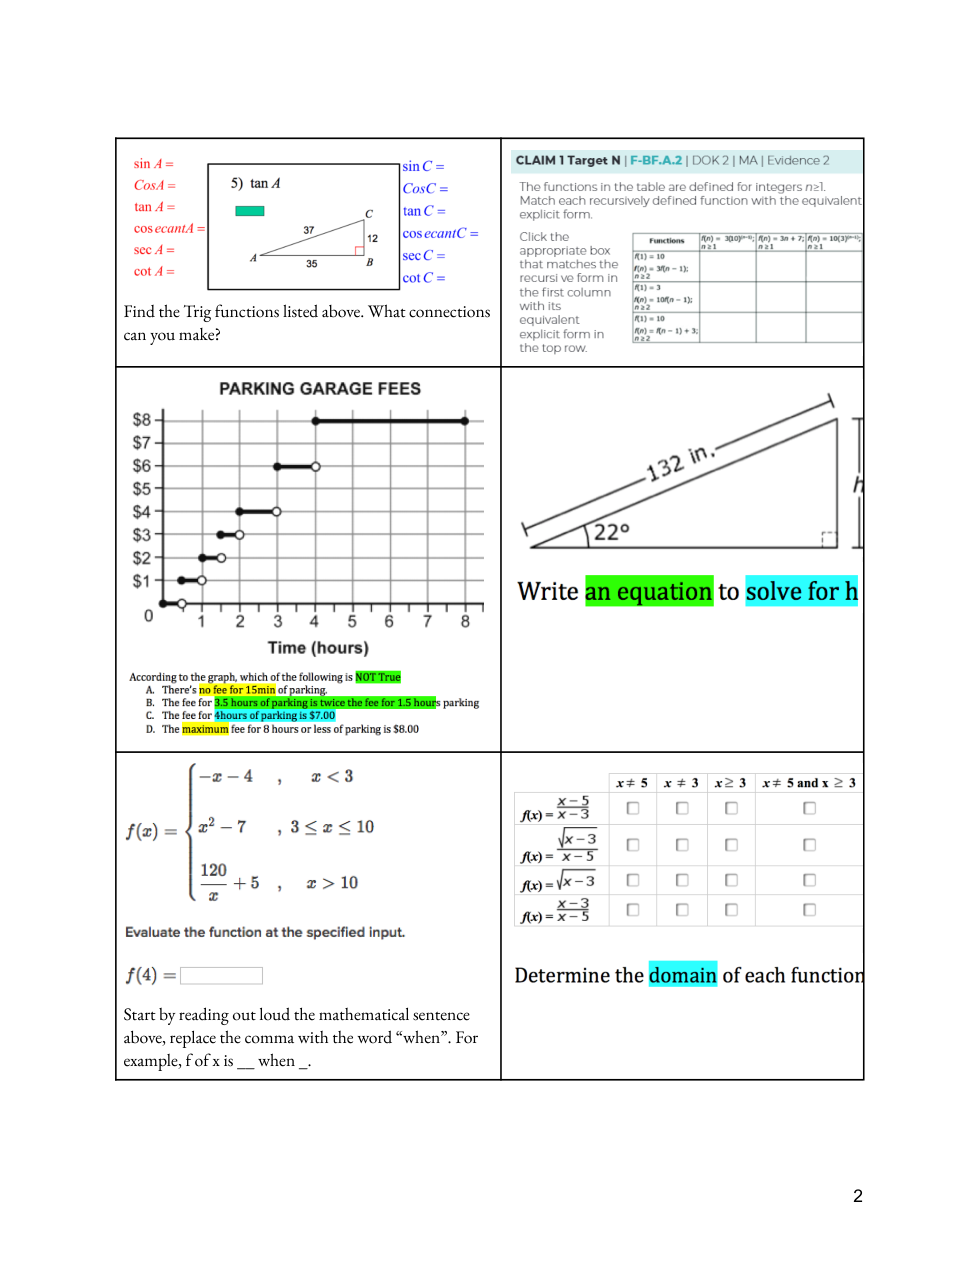
Find the Trig functions listed above. What connections can you make?
Start by reading out loud the mathematical sentence above, replace the comma with the word "when". For example, f of x is __ when _.
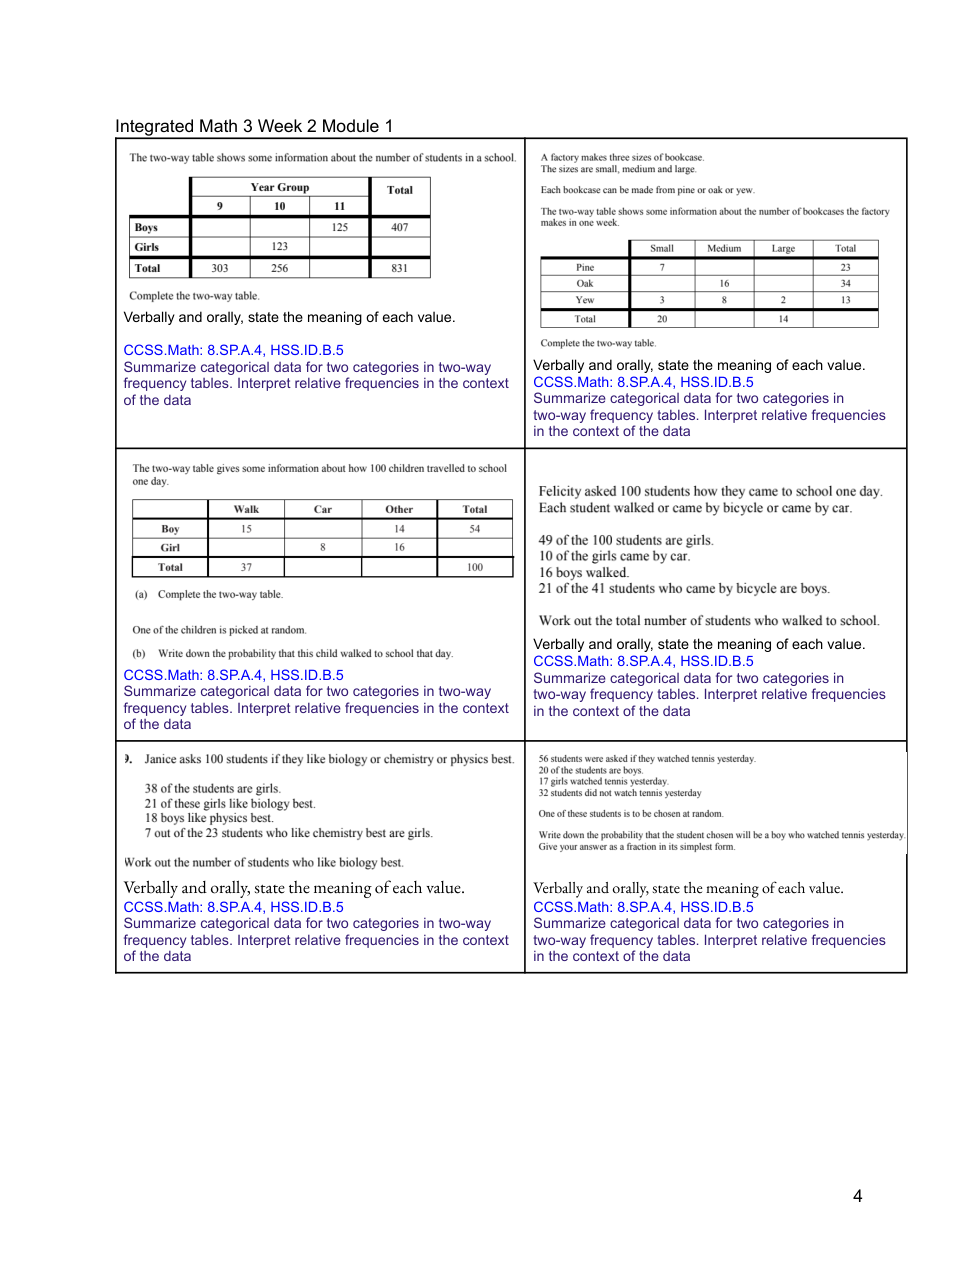
Verbally and orally, state the meaning of each value.
Summarize categorical data for two categories in two-way frequency tables. Interpret relative frequencies in the context of the data.
Verbally and orally, state the meaning of each value.
Summarize categorical data for two categories in two-way frequency tables. Interpret relative frequencies in the context of the data.

One of these 80 students is selected at random. What is the probability that this child went to London?
Summarize categorical data for two categories in two-way frequency tables. Interpret relative frequencies in the context of the data
Be sure that your reasoning is based on the given information, not your opinion. You may use equations, tables, and graphs to justify your reasoning.
Verbally and orally, state the meaning of each value.
Summarize categorical data for two categories in two-way frequency tables. Interpret relative frequencies in the context of the data.
Complete the table. Then, Verbally and orally, state the meaning of each value.
Summarize categorical data for two categories in two-way frequency tables. Interpret relative frequencies in the context of the data
Task: Produce a table of values with input and output; Draw a graph from your table of values; Write an equation or formula; Reflect upon your experience by drawing some conclusions or by forming some hypothesis based on your analysis; Articulate your thoughts in language (writing).
Be sure that your reasoning is based on the given information, not your opinion. You may use equations, tables, and graphs to justify your reasoning.
Represent constraints by equations or inequalities, and by systems of equations and/or inequalities, and interpret solutions as viable or nonviable options in a modeling context. 5