Open Up Math - Unit 2 - Pretest
star
star
star
star
star
Posljednje ažuriranje almost 3 years ago
11
Napomena autora:
Version A of the Unit 2 end of unit assessment used as the pre-test for the unit.
1
Version A of the Unit 2 end of unit assessment used as the pre-test for the unit.
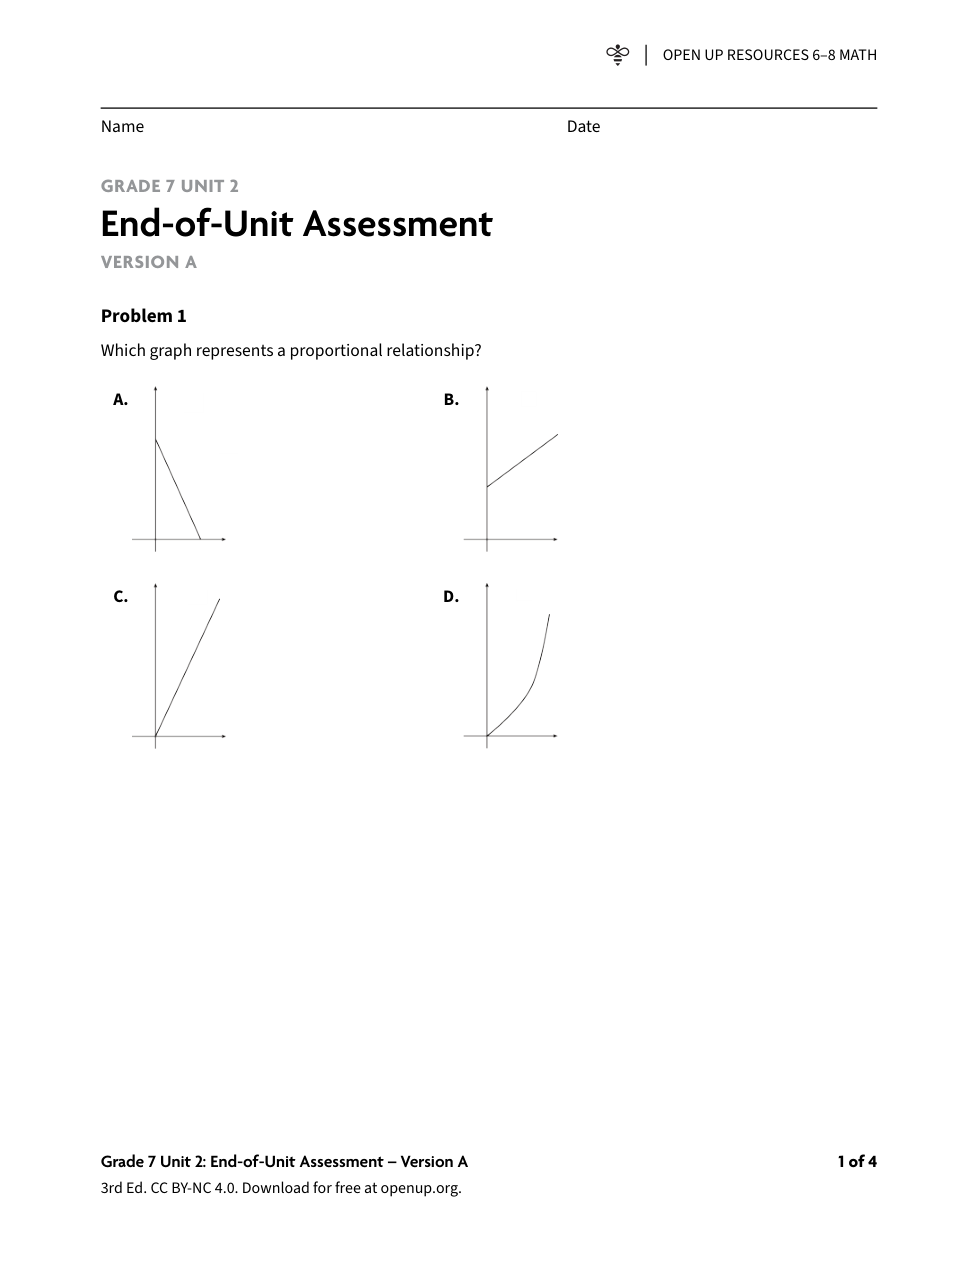
Which graph represents a proportional relationship?
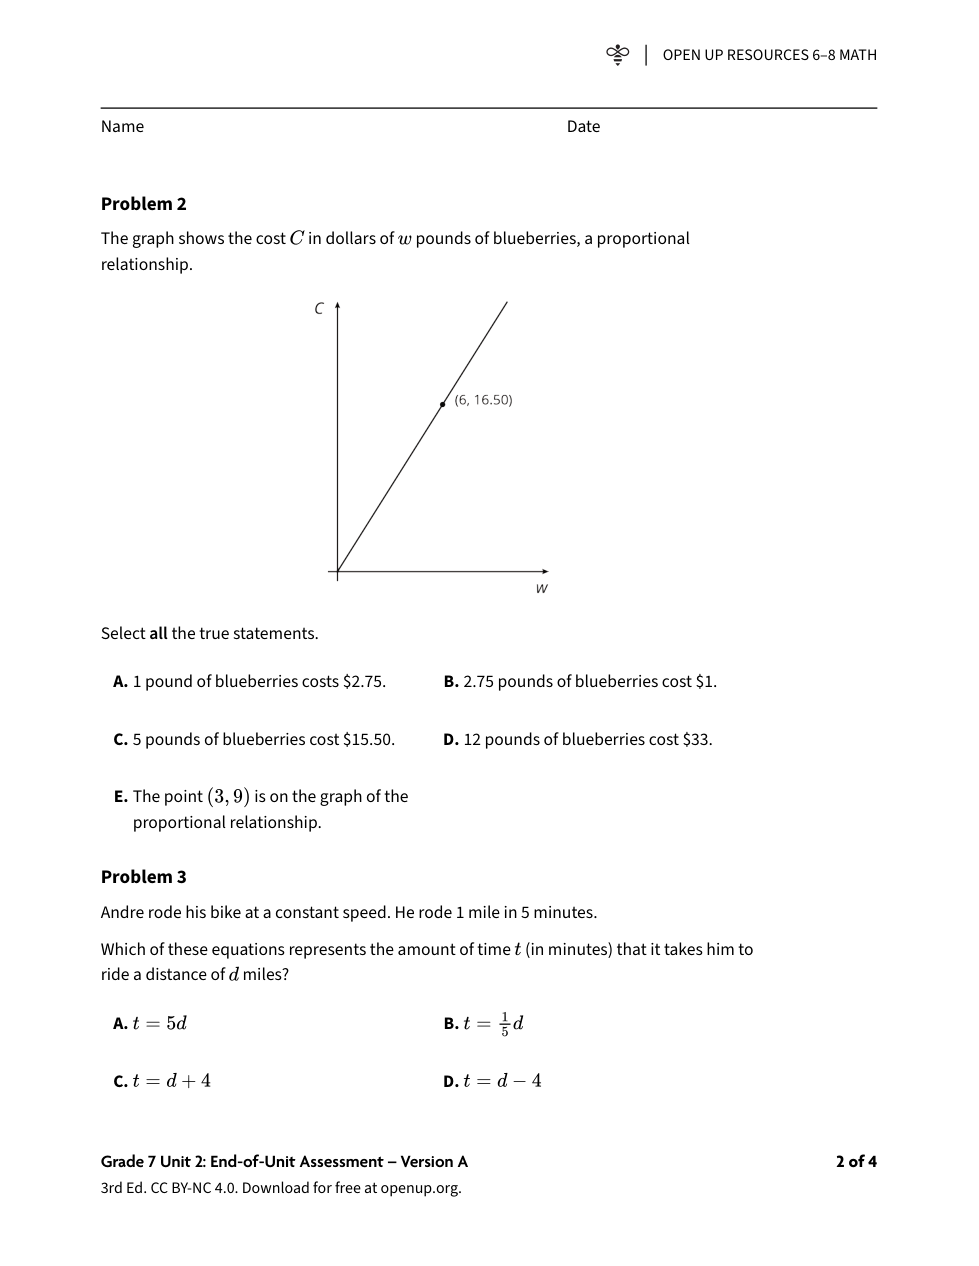
The graph shows the cost C in dollars of w pounds of blueberries, a proportional relationship.
Select ALL of the true statements.
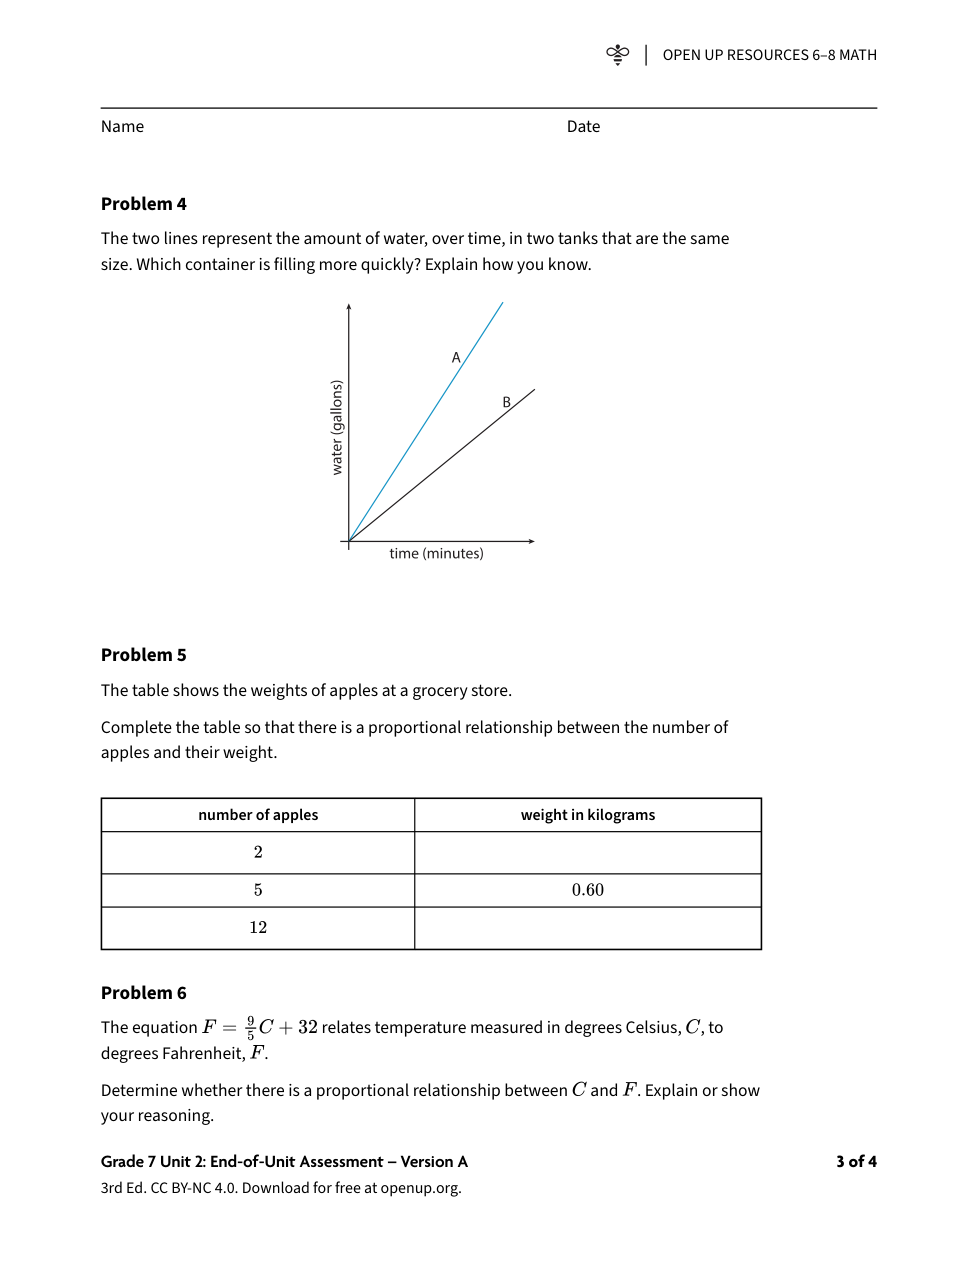
The two lines represent the amount of water, over time, in two tanks that are the same size. Which container is filling more quickly? Explain how you know.
The table shows the weights of apples at a grocery store.
Complete the table so that there is a proportional relationship between the number of apples and their weight.
Explain or show your answer to number 6 by either taking a picture of your work and posting it below, or by using the typing/drawing tools to show your work.
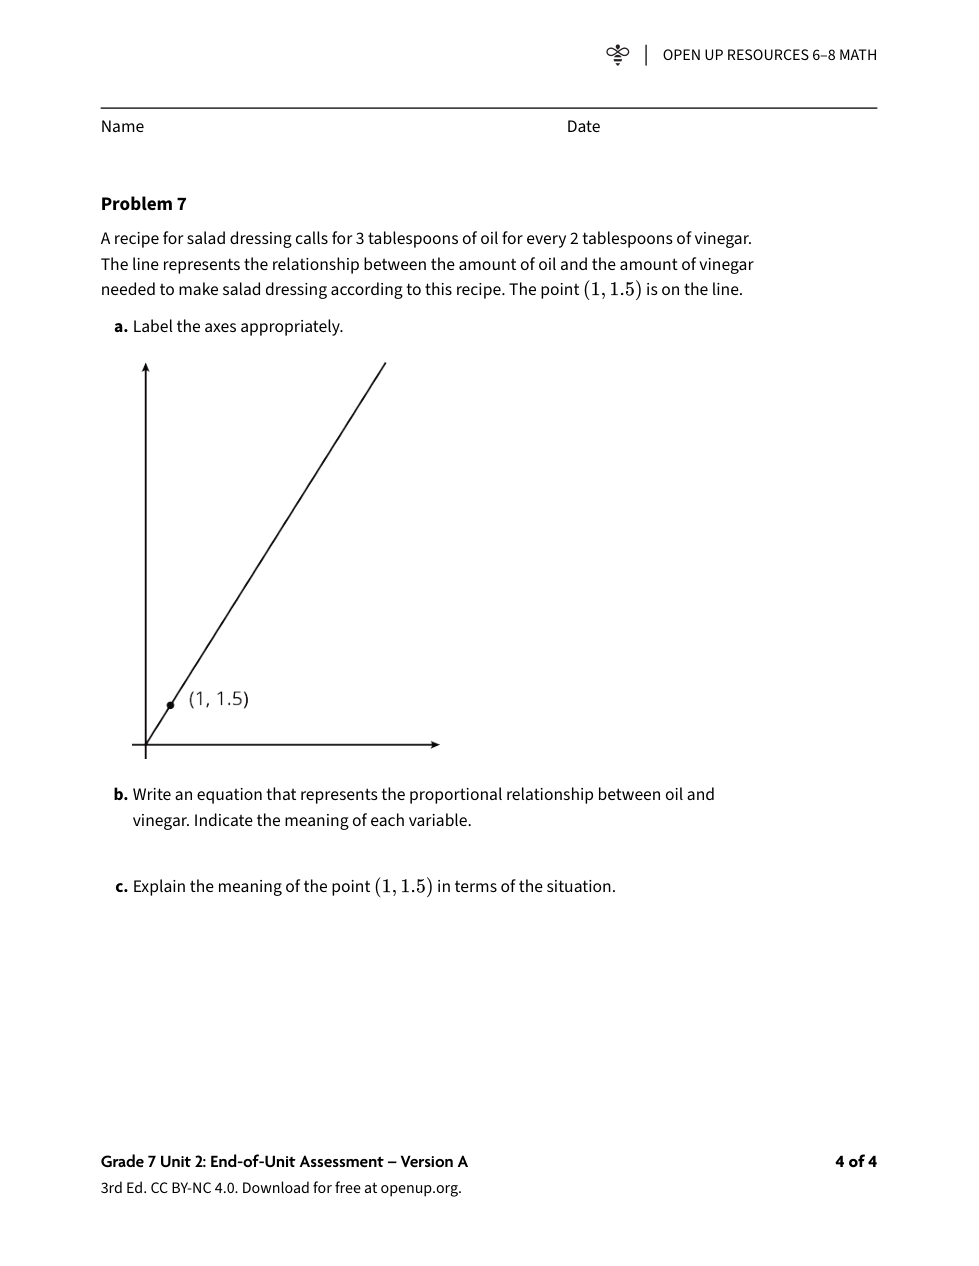
A recipe for salad dressing calls for 3 tablespoons of oil for every 2 tablespoons of vinegar. The line represents the relationship between the amount of oil and the amount of vinegar needed to make salad dressing according to this recipe. The point (1,1.5) is on the line.
Using the drawing or typing tool below, Label the axes appropriately.
Using the math tools, write an equation that represents the proportional relationship between oil and vinegar. Use the variables x and y in your equation.
Indicate the meaning of each variable from your equation you created.
x represents the amount of
Explain the meaning of the point (1,1.5) in terms of the situation. (What does the 1 represent, and what does the 1.5 represent?)
Andre rode his bike at a constant speed. He rode 1 mile in 5 minutes.
Which of these equations represents the amount of time t (in minutes) that it takes him to ride a distance of d miles?