
Obavezno
1
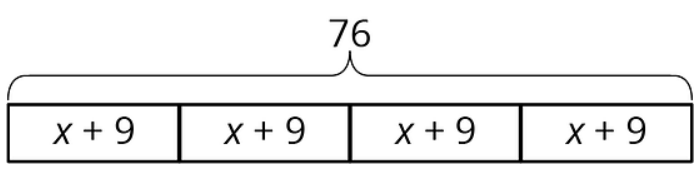
This tape diagram represents which situation best?
This tape diagram represents which situation best?
Open Up Ciriculum Unit 6 Expressions
Distributive Property
Tape Diagrams
Combining Like Terms
You may use calculators, your Open Up workbook and online resources, and your notes to complete this work.
Simplify the expression. (Combine the like terms)
2x + 4w + 7x
Match the correct simplifications of the expressions.
| Stavka koja se može prevući | arrow_right_alt | Odgovarajuća stavka |
|---|---|---|
14x + 5y -7x | arrow_right_alt | 7x - 5y |
3x - 5y + 4x | arrow_right_alt | 6x + 12 |
3(2x + 4) | arrow_right_alt | 8x + 6 |
2(4x + 3) | arrow_right_alt | 7x + 5y |
A _____________________ is a fixed quantity that does not vary. (A number)
Simplify the expression. (Combine the like terms)
4m + 5m - m
A ________________________ is a quantity that can vary (change); represented by a letter or symbol.
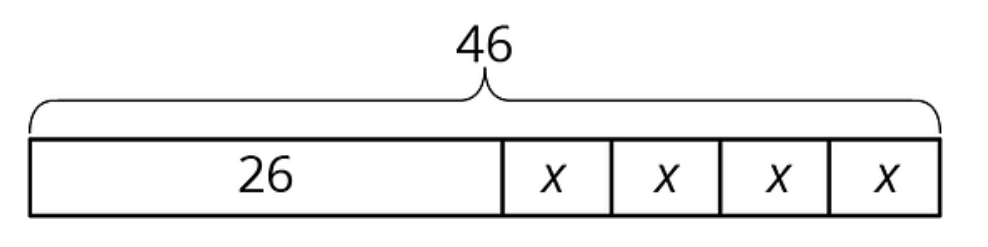
This tape diagram represents which situation best?
Simplify the expression. (Use the distributive property)
7(4x + 3)
Simplify the expression. (Use the distributive property)
6(4 + 8x)
Which situation best describes this tape diagram?
Which equations describe this diagram?
An architect is drafting plans for a new supermarket. There will be a space 144 inches long for rows of nested shopping carts. The first cart is 34 inches long and each nested cart adds another 10 inches. The architect wants to know how many shopping carts will fit in each row.
Which equation best represents the situation?
Kiran is trying to save $160 to buy a new guitar. He has $25 and is going to save $10 a week from money he earns mowing lawns. He wants to know how many weeks it will take him to have enough money to buy the guitar.
Which equation best describes the situation?