Lesson 5 Summary
star
star
star
star
star
Last updated over 1 year ago
16 questions

Required
1
Look at the graph: Which of the following describes a possible explanation of the change in population between 1980 and 1982?
Required
3
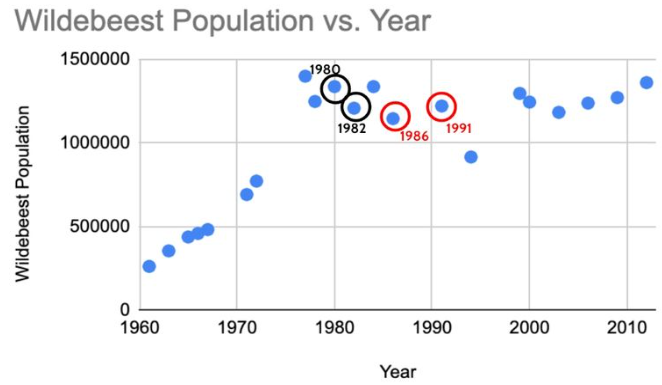
Based on the rates of change, In which time period 1980-1982 or 1986-1991 was there more likely to have been a drought?
__________: During this time, the rate of change is __________ meaning that there were __________.
Required
1
Based on the graph, estimate the population decrease between 1991 and 1993.
Required
1
What limiting factor might have caused this change? (write a single word)
Required
1
Carrying capacity is the maximum number of individuals in a population that the environment can sustain.Scientists have established the carrying capacity of wildebeest at 1.3 million in the Serengeti ecosystem. They predict that the population will fluctuate around this number if conditions in the ecosystem stay the same. Which of the following graphs represents this prediction?
Carrying capacity is the maximum number of individuals in a population that the environment can sustain.
Scientists have established the carrying capacity of wildebeest at 1.3 million in the Serengeti ecosystem. They predict that the population will fluctuate around this number if conditions in the ecosystem stay the same. Which of the following graphs represents this prediction?
Required
1
Scientists have established the carrying capacity of wildebeest at 1.3 million in the Serengeti ecosystem. Which of the following graphs represents the most likely outcome for the wildebeest if the total area of the park suddenly decreased and all other components of the system stayed the same?
Required
3
A limiting factor is any factor that restrain population growth. Limiting factors can be biotic or abiotic. Categorize each of the limiting factors below.
- Predation
- Parasitism
- Weather
- Water
- Food
- Fire
- Biotic limiting factor
- Abiotic limiting factors
Required
3
A limiting factor is any factor that restrain population growth. Limiting factors can be TOP-DOWN or BOTTOM-UP.
Top-down limiting factors - exert their effects from HIGHER trophic levels (i.e., predators affecting prey)Bottom-up limiting factors - exert their effects from LOWER trophic levels (i.e., availability of resources)
Categorize each of the limiting factors below.
A limiting factor is any factor that restrain population growth. Limiting factors can be TOP-DOWN or BOTTOM-UP.
Top-down limiting factors - exert their effects from HIGHER trophic levels (i.e., predators affecting prey)
Bottom-up limiting factors - exert their effects from LOWER trophic levels (i.e., availability of resources)
Categorize each of the limiting factors below.
- Predation
- Parasitism
- Food
- Habitat area
- Weather
- Water
- Fire
- Top-down limiting factor
- Bottom-up limiting factors
- Neither
Required
3
A limiting factor is any factor that restrain population growth. Density-dependent or density independent. Density-dependent limiting factors affect large populations differently than small populations (either good or bad). - For instance, food availability is not an issue when a population is small.
Density-independent limiting factors affect all populations the same, regardless of size.- For instance, fires will kill the same % of organisms regardless of how big the population is.
Categorize each of the limiting factors below.
A limiting factor is any factor that restrain population growth. Density-dependent or density independent.
Density-dependent limiting factors affect large populations differently than small populations (either good or bad).
- For instance, food availability is not an issue when a population is small.
Density-independent limiting factors affect all populations the same, regardless of size.
- For instance, fires will kill the same % of organisms regardless of how big the population is.
Categorize each of the limiting factors below.
- Predation
- Parasitism
- Food
- Habitat area
- Weather
- Water
- Fire
- Density-dependent limiting factor
- Density-independent limiting factors

Required
1
The graph shows the migratory wildebeest population from 1890 - 2010.Carrying capacity is represented by dotted lines. What was the limiting factor that caused the carrying capacity to change in the 1890's? (write one word)
The graph shows the migratory wildebeest population from 1890 - 2010.
Carrying capacity is represented by dotted lines. What was the limiting factor that caused the carrying capacity to change in the 1890's? (write one word)
Required
1
When the disease was limiting the population, the actual population size fluctuated from year to year. Which of these is the most likely explanation.
Required
1
In about 1960, the limiting factor that was restraining growth was removed. How would you characterize the population growth pattern in the subsequent 10 years.
Required
1
How would you characterize the population growth pattern for the period 1960-1992?
Required
1
What is the limiting factor that is restraining growth from 1960-1992?

Required
1
All of the animals on the graph are Serengeti herbivores. Which of the herbivores are limited from the top-down?
Required
1
From the video: According to their size, you would expect that wildebeests are more likely to be regulated from the top-down. This is true for the resident wildebeests (those that don't migrate). Why is this NOT the case for the migrating wildebeests?