Dr. Sinclair was interested in studying how food was driving the wildebeest migration. Through experimentation, he found out exactly how much the grass would grow with certain amounts of rain. This allowed him to measure rain instead of measuring the grass directly. Which of the following are advantages of measuring rain over directly measuring the growth of grass? (pick three)
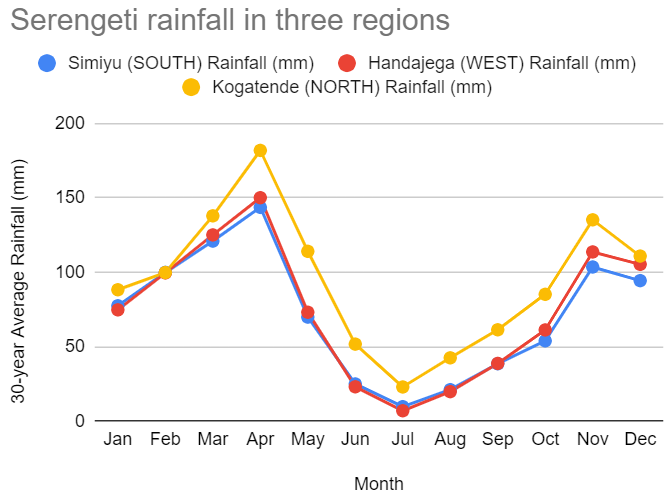
Based on the graph,
1. Write a sentence that DESCRIBES the trend seen across the entire Serengeti.
2. Write a sentence that CONNECTS this trend to trends from previous lessons.
Based on the graph,
1. Write a sentence that DESCRIBES a difference between the NORTH and the other two regions.
2. Write a sentence that CONNECTS this difference to the movement of wildebeests in the SUMMER.
A scatterplot is a graph that presents the relationship between two continuous variables (graphed on the x and y axis).
A trendline (line of best fit) is a calculated line whose slope represents the nature of the correlation.
Positive slope = positive relationship (as x ↑, y ↑)
Negative slope = negative relationship (as x ↑, y ↓)
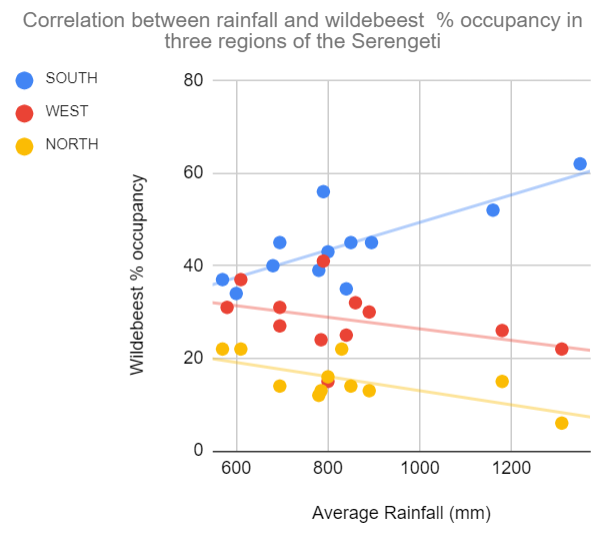
Positively related | Negatively related | No relationship | |
|---|---|---|---|
South | |||
West | |||
North |
We thought that food availability (measured by rainfall) might explain wildebeest movement. In which region(s) does this appear to be true?
We thought that food availability (measured by rainfall) might explain wildebeest movement. In which region(s) do we still need to figure out?
Propose an explanation for what is motivating wildebeest movement in the West and the North.