Log in
Sign up for FREE
arrow_back
Library
ACT Charts and Graphs 9
By Abigail Clark
star
star
star
star
star
Share
share
Last updated over 2 years ago
1 question
Add this activity
zoom_in
zoom_in
Required
1
Question 1
1.
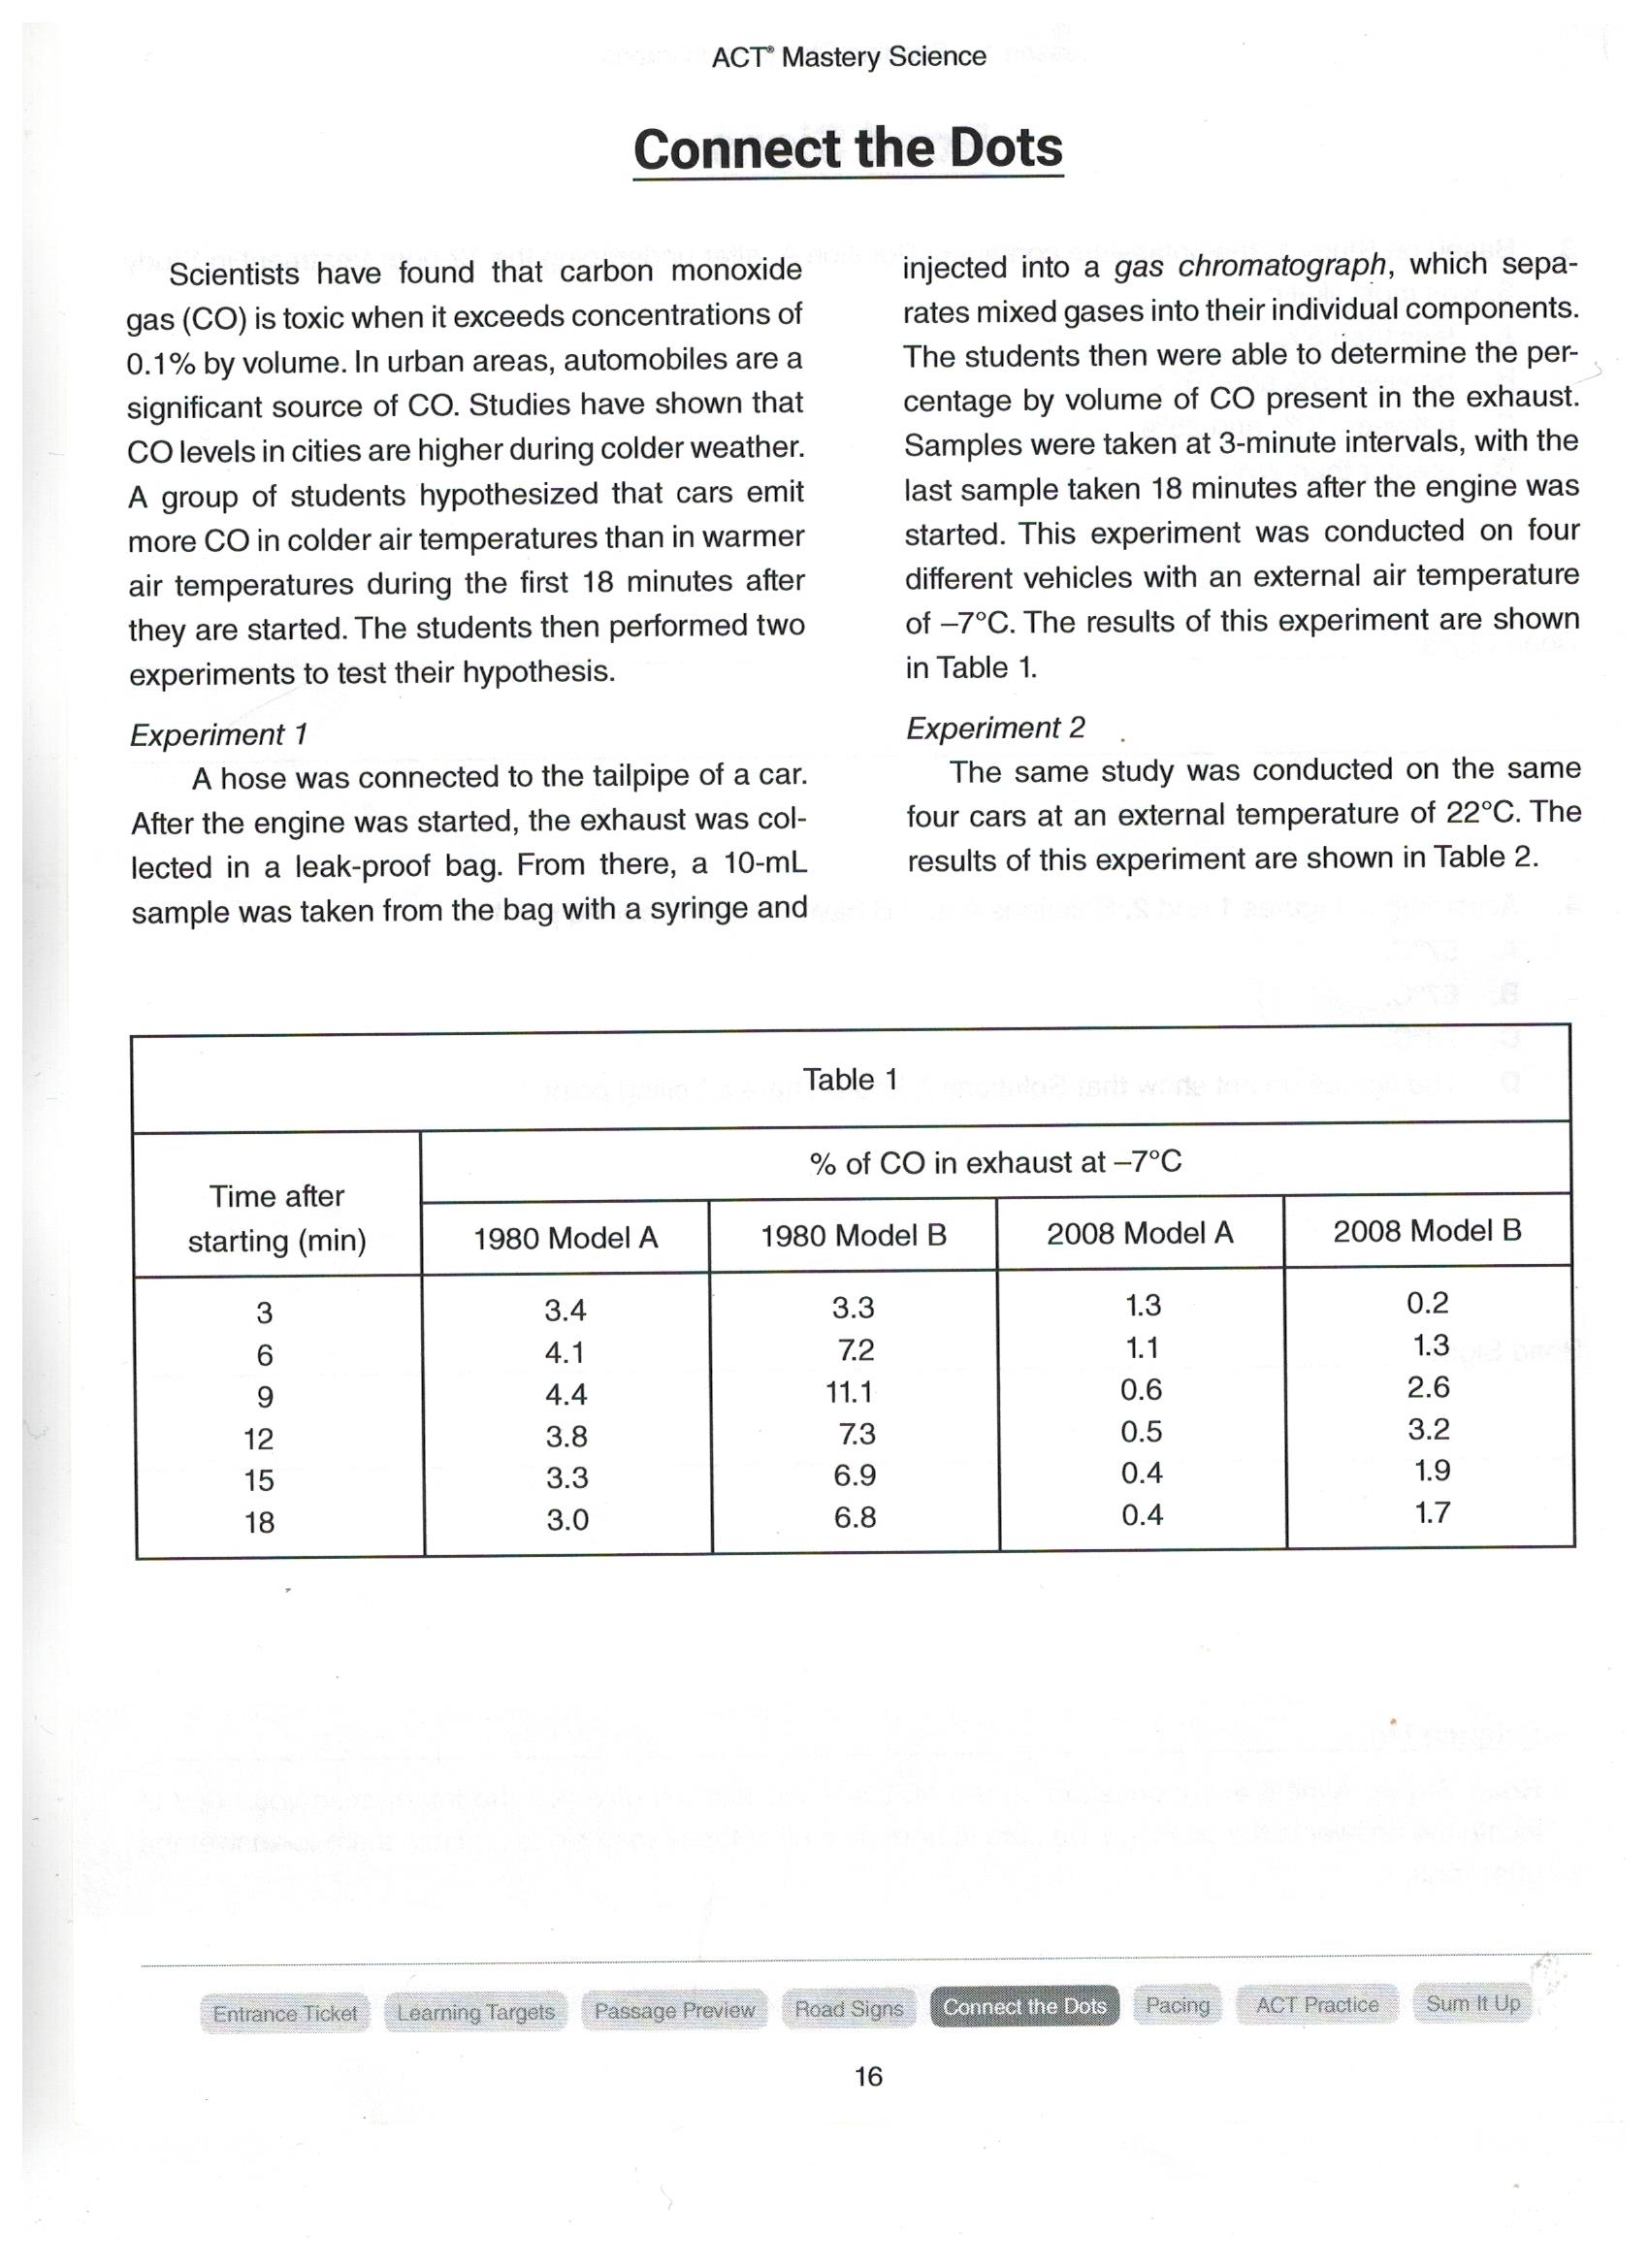
What percent of CO was present in the exhaust of the 1980 model A at -7*C after 6 minutes
3.3%
4.1%
4.4%
7.2%