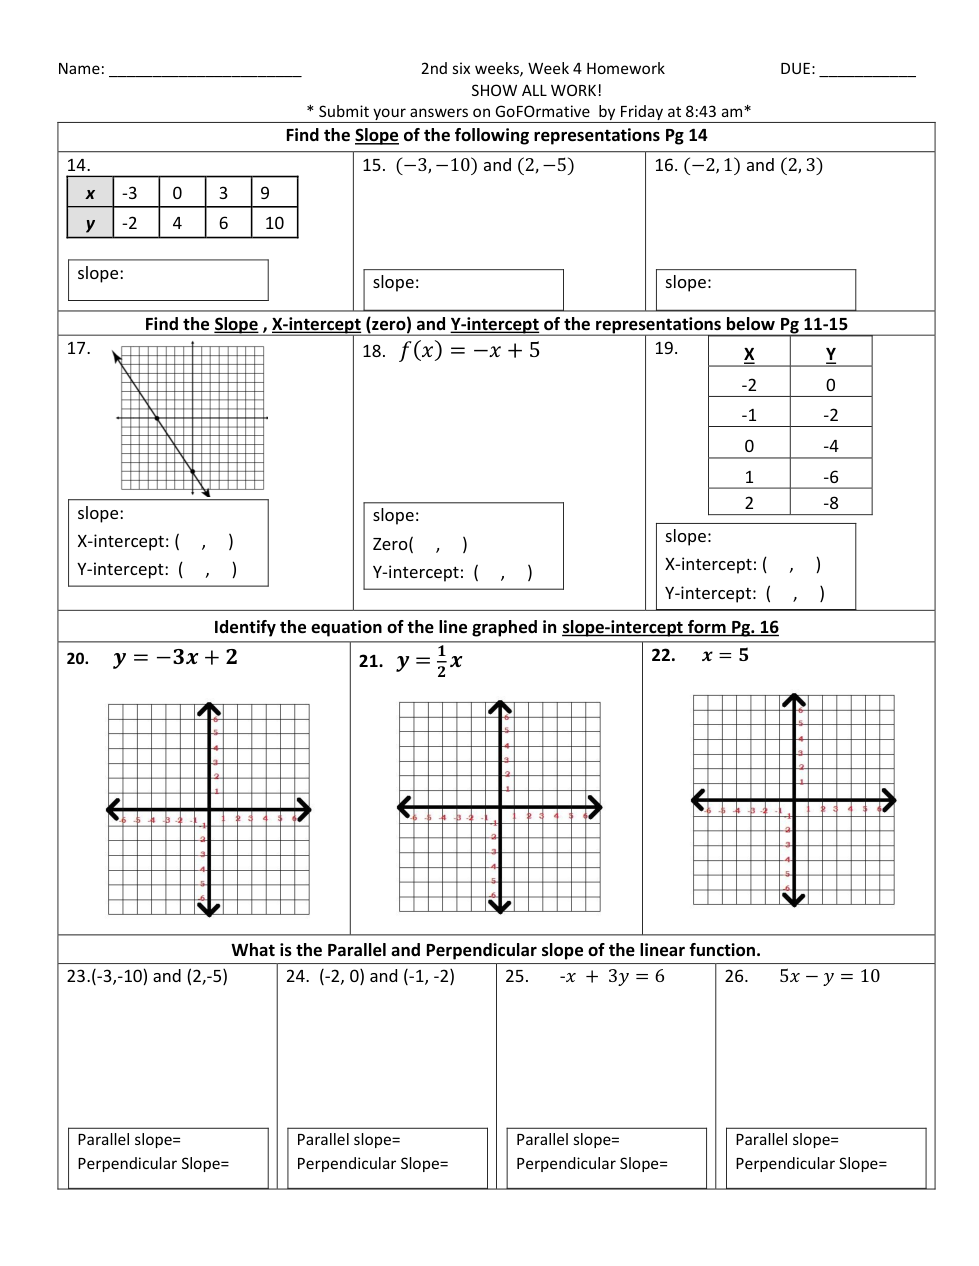
Choose the correct slope, x-intercept and y-intercept
Pitanje 12
12.
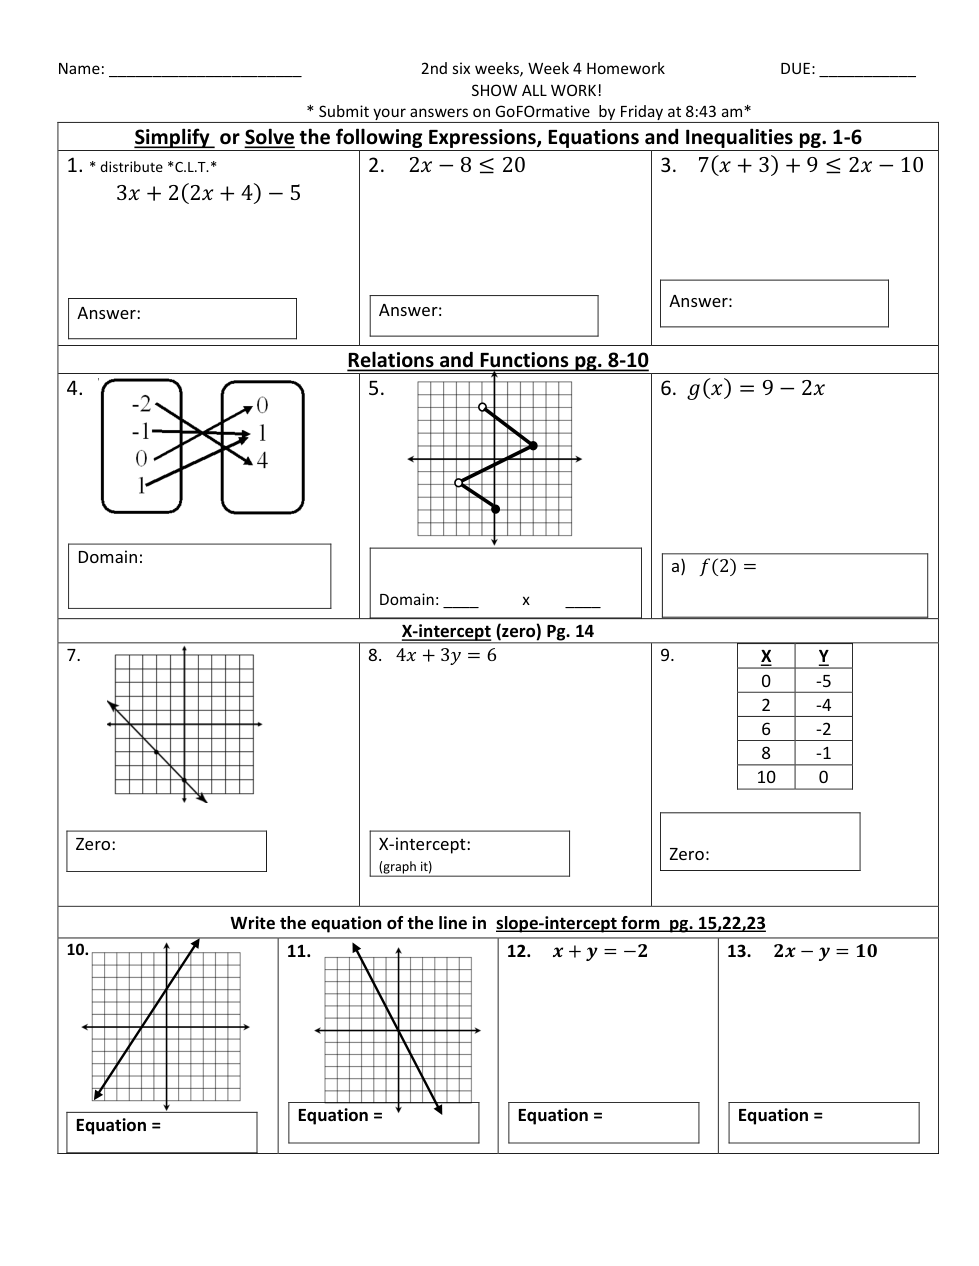
Graph the equation given
Kliknite na karticu Grafikon (Grafikon 1, Grafikon 2 i tako dalje) za svaki grafikon koji trebate nacrtati.
Kliknite na pozadinu grafikona da biste dodali tačku. Dodajte dvije tačke da biste kreirali grafikon. Prevucite tačku ili unesite x i y koordinate da biste uredili njen položaj. Kliknite na tačku da biste je izbrisali.
Nakon što kreirate grafikon, možete označiti kućicu s isprekidanom linijom.
Pitanje 13
13.
Kliknite na karticu Grafikon (Grafikon 1, Grafikon 2 i tako dalje) za svaki grafikon koji trebate nacrtati.
Kliknite na pozadinu grafikona da biste dodali tačku. Dodajte dvije tačke da biste kreirali grafikon. Prevucite tačku ili unesite x i y koordinate da biste uredili njen položaj. Kliknite na tačku da biste je izbrisali.
Nakon što kreirate grafikon, možete označiti kućicu s isprekidanom linijom.
Pitanje 14
14.
Kliknite na karticu Grafikon (Grafikon 1, Grafikon 2 i tako dalje) za svaki grafikon koji trebate nacrtati.
Kliknite na pozadinu grafikona da biste dodali tačku. Dodajte dvije tačke da biste kreirali grafikon. Prevucite tačku ili unesite x i y koordinate da biste uredili njen položaj. Kliknite na tačku da biste je izbrisali.
Nakon što kreirate grafikon, možete označiti kućicu s isprekidanom linijom.