A researcher is designing a study to assess free-throw ability in basketball. How could they improve the reliability of the data?
I. Increase the number of participants
II. Allow participants to record their own scores
III. Increase the number of trials per participant
A student measures flexibility using five trials of the sit and reach test. They record the same result for each trial for the first participant. Which does this provide evidence for?
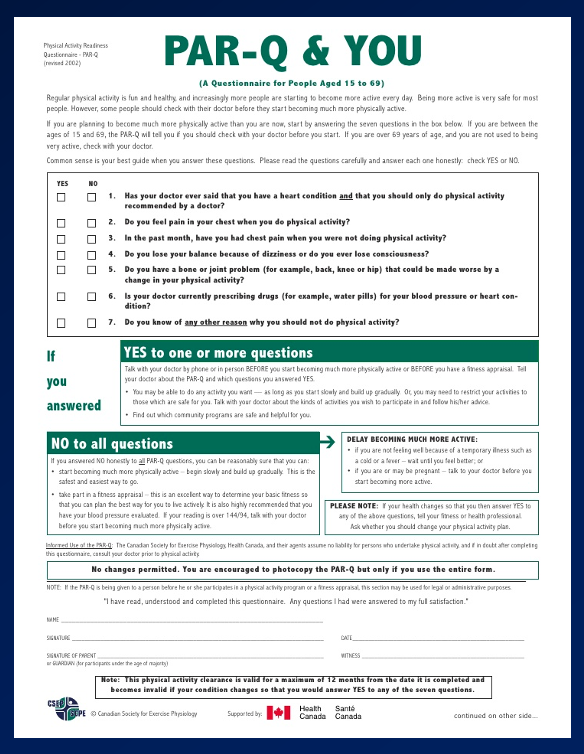
Alex signs up at the local gym and is required to complete a Physical Activity Readiness Questionnaire (PAR-Q). What is the purpose of this questionnaire?


What is a benefit of a maximal test?
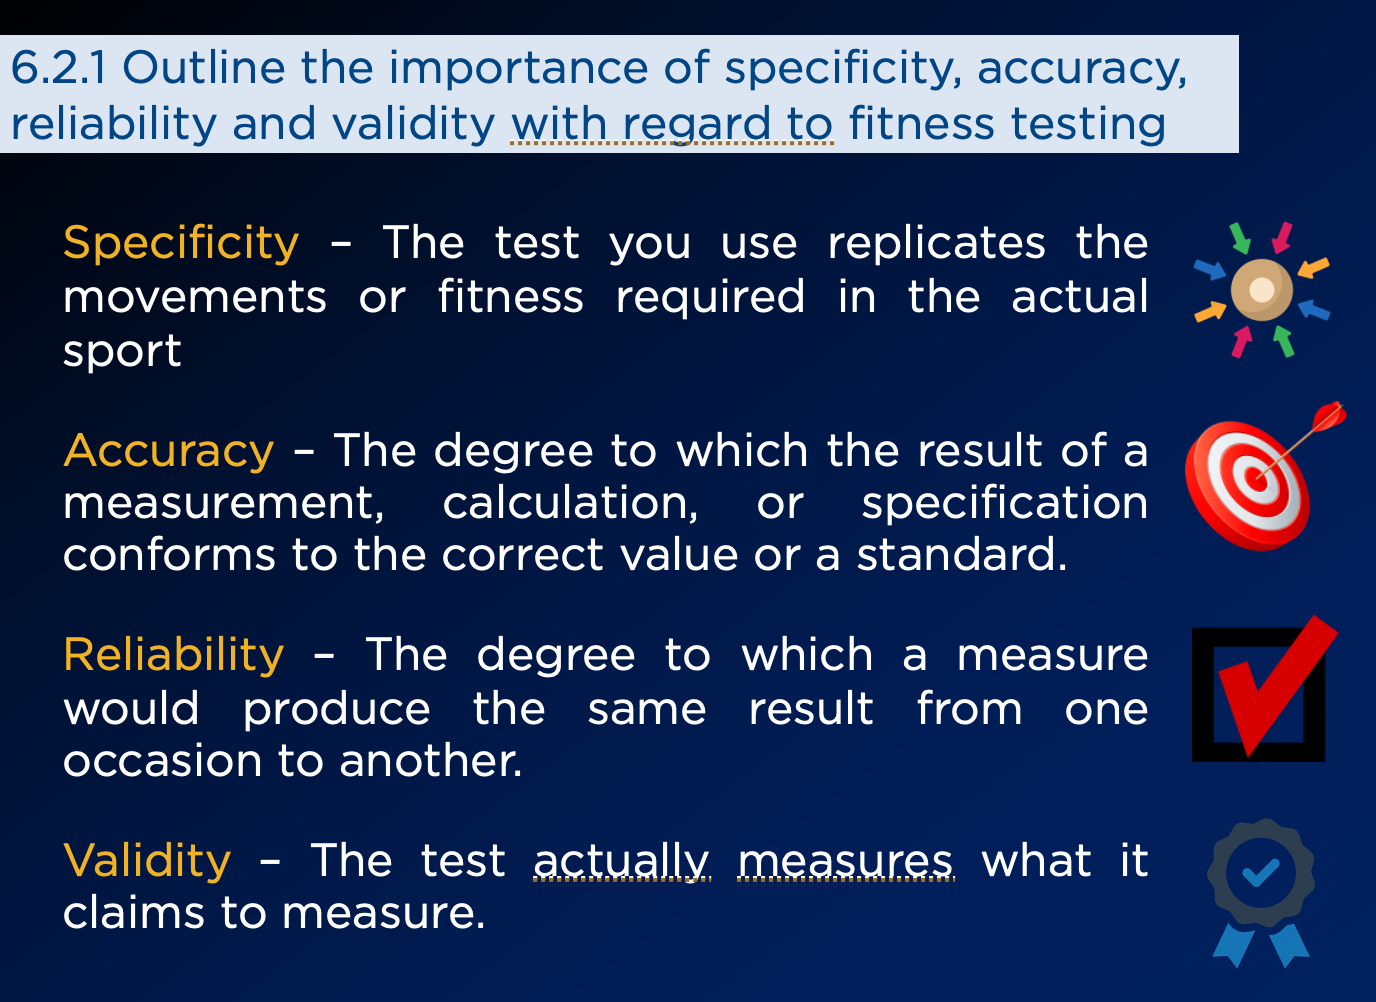
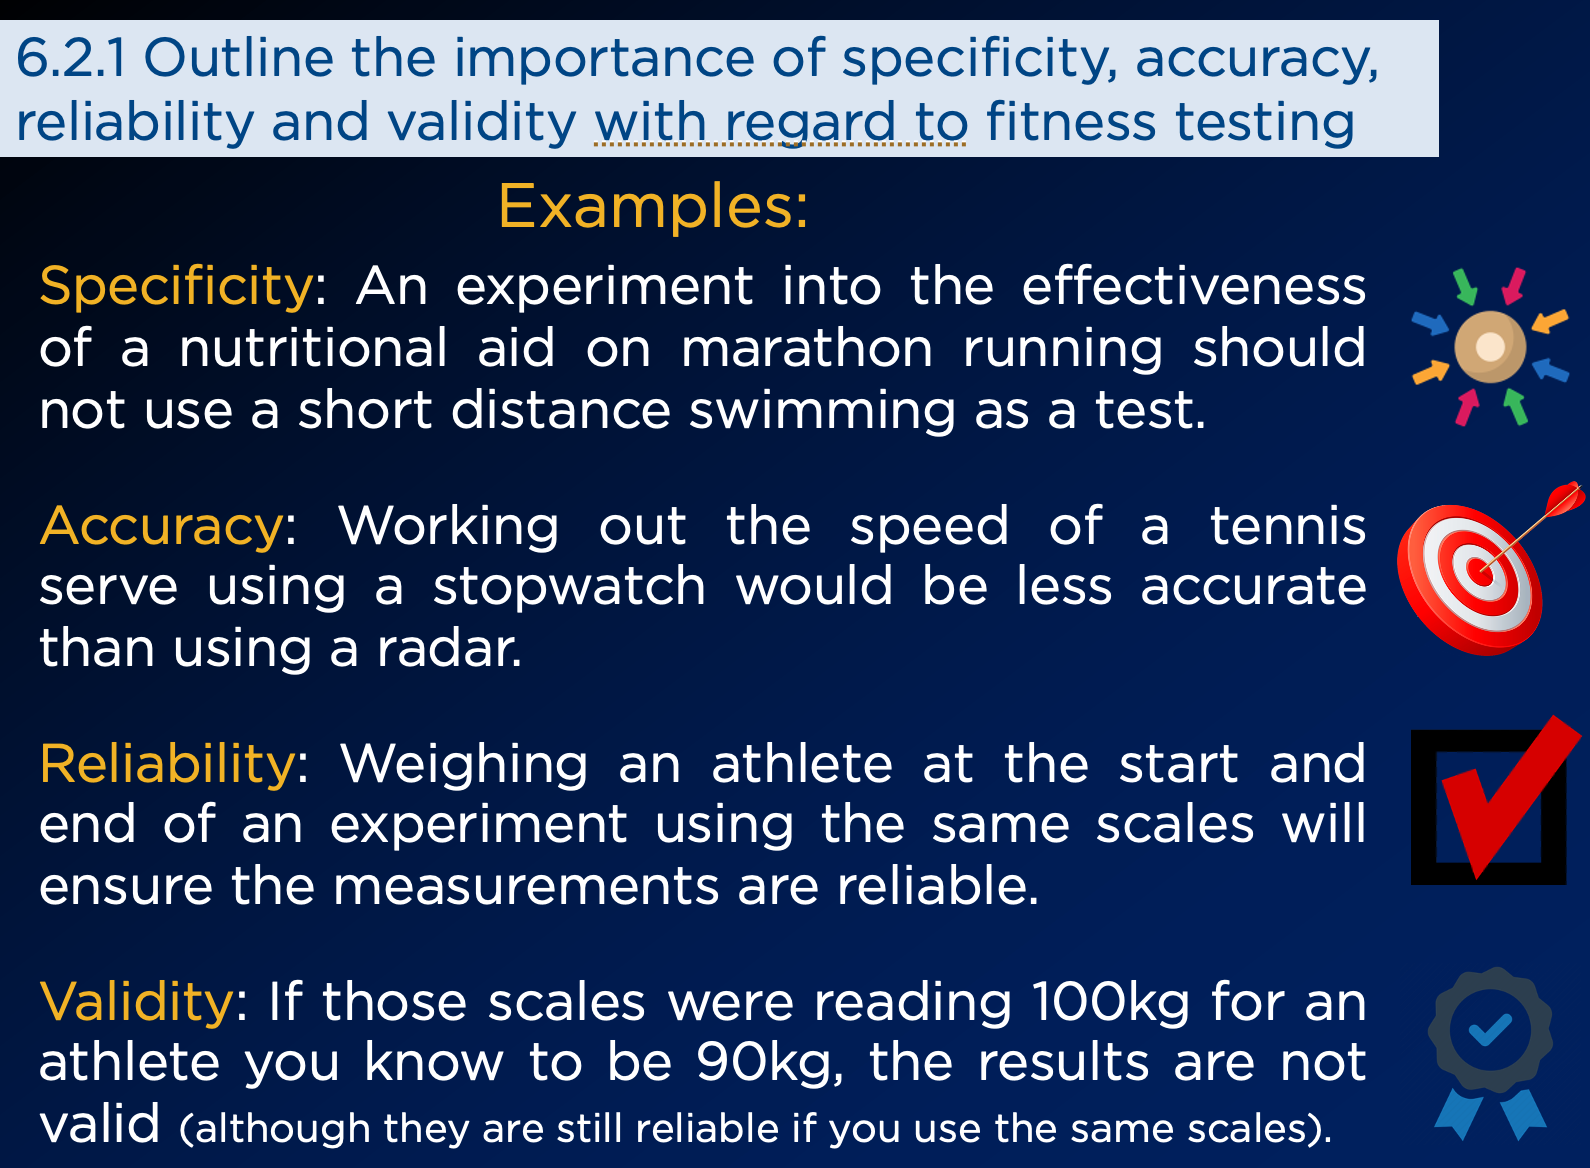
What makes a fitness test reliable?
Which terms apply to the use of the multistage fitness test to evaluate the muscular power of a 100 m swimmer?
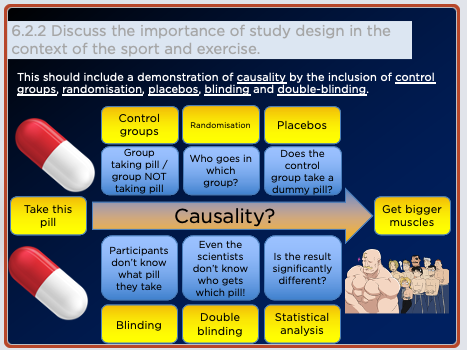
Which is correct with regard to study design?
Which of these describes appropriate study design?
A study investigated the effects of a carbohydrate-rich mouthwash on soccer players. The investigators used a double-blind protocol. What characterizes a double-blind study?
A study investigated the impact of heavy and moderate load-resistance training on nutritional intake. Nineteen resistance-trained athletes were randomly assigned to one of two groups:
Heavy training load group: Trained in a loading range of 90–95 % of 1 repetition maximum (1 RM); 2 – 4 repetitions per set;
Moderate training load group: Trained in a loading range of 80–85 % of 1 RM; 8 – 12 repetitions per set.
Both groups performed 3 sets of 7 exercises for the major muscle groups of the upper and lower body. Training took place 3 days a week for 8 weeks. The nutritional intake of participants was monitored during the study.

(a) Identify the training method and nutritional component that indicated the greatest proportional change pre- and post-intervention.
(b) Calculate the difference in fat intake pre- and post-testing for the heavy training load group.
A company has developed a drink to improve the performance of athletes during endurance events, such as the Tour de France cycling race.
Describe four study design features which could be used in an experiment to test if the sports drink is beneficial to endurance performance.
*Mark scheme in hints but try to answer it first!
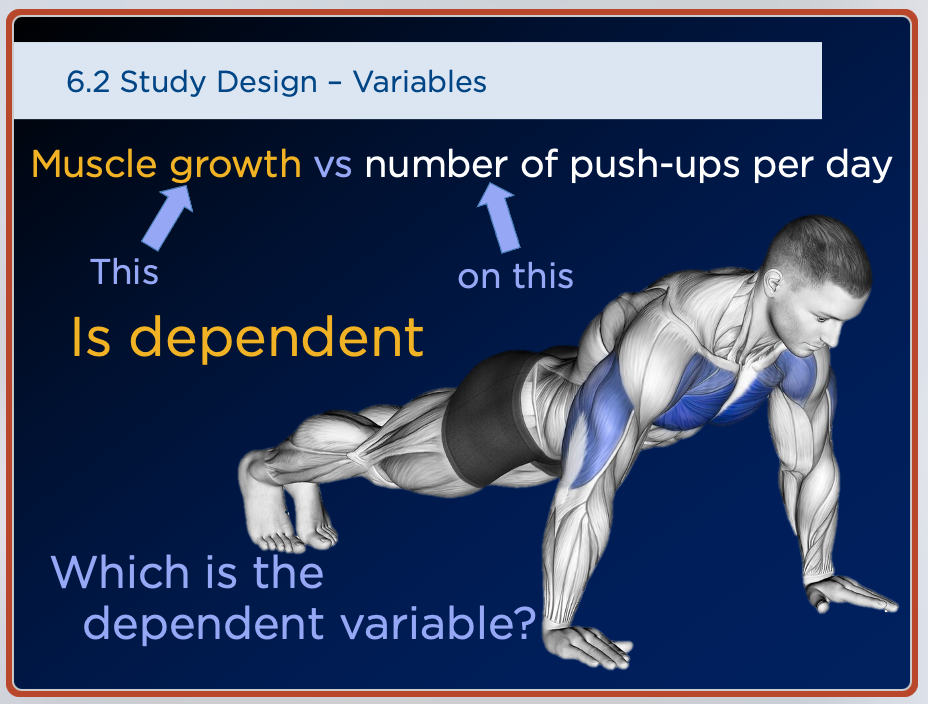
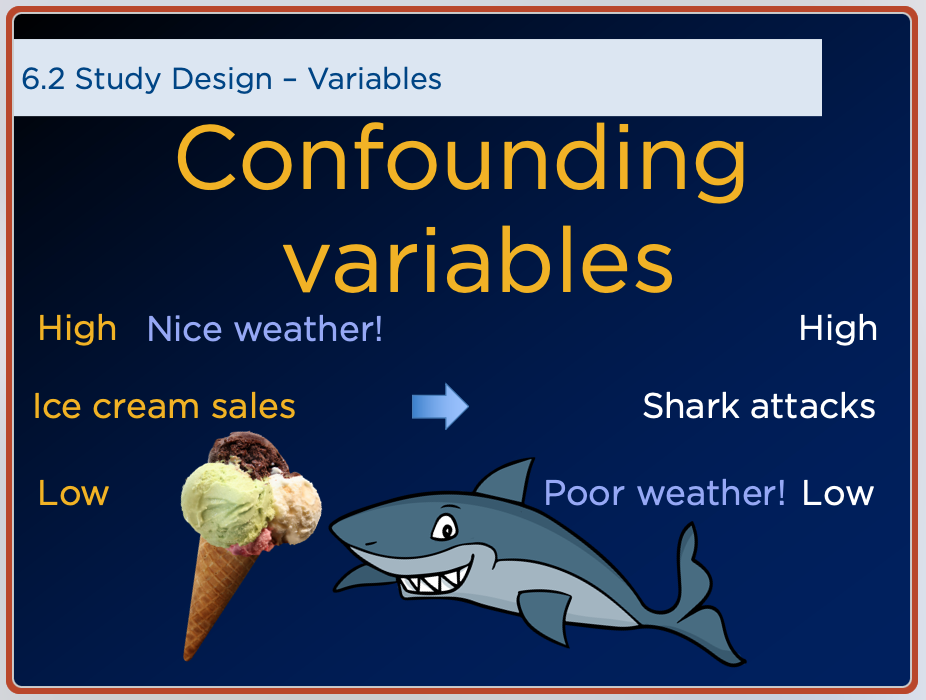
Suggest a cause an effect study.
Highlight:
A: The dependent variable.
B: The independent variable.
C: A possible confounding variable.
It doesn't have to be a sensible or even a possible test, as long as you show an understanding of the difference in the above variables.
A study investigated the effect of plyometric exercise on sprint speed. (Plyometric exercise involves rapid and repeated stretching and contracting of the muscles.) The mean speed of each participant was measured during a 20 m sprint as a baseline and then in a further five 20 m sprints. During the first 75 seconds of the interval between sprints the participants carried out one of the following activities:
Plyometric: three sets of alternate leg bounds (running-like movement, jumping from one leg to the other consecutively)
Control: continuous walking.
The graph shows the mean sprint speed and positive standard deviation value for both conditions.

A paired t-test was conducted to compare mean sprint speed at 4 minutes with mean sprint speed at baseline. The results were:
Plyometric condition: p < 0.05
Control condition: p > 0.05
(a) Identify the time and condition with the highest mean sprint speed.
A study investigated the effect of plyometric exercise on sprint speed. (Plyometric exercise involves rapid and repeated stretching and contracting of the muscles.) The mean speed of each participant was measured during a 20 m sprint as a baseline and then in a further five 20 m sprints. During the first 75 seconds of the interval between sprints the participants carried out one of the following activities:
Plyometric: three sets of alternate leg bounds (running-like movement, jumping from one leg to the other consecutively)
Control: continuous walking.
The graph shows the mean sprint speed and positive standard deviation value for both conditions.
A paired t-test was conducted to compare mean sprint speed at 4 minutes with mean sprint speed at baseline. The results were:
Plyometric condition: p < 0.05
Control condition: p > 0.05
(b) Calculate the difference in mean sprint speed, in m s–1, between baseline and at 4 minutes for the plyometric condition.
A study investigated the effect of plyometric exercise on sprint speed. (Plyometric exercise involves rapid and repeated stretching and contracting of the muscles.) The mean speed of each participant was measured during a 20 m sprint as a baseline and then in a further five 20 m sprints. During the first 75 seconds of the interval between sprints the participants carried out one of the following activities:
Plyometric: three sets of alternate leg bounds (running-like movement, jumping from one leg to the other consecutively)
Control: continuous walking.
The graph shows the mean sprint speed and positive standard deviation value for both conditions.
A paired t-test was conducted to compare mean sprint speed at 4 minutes with mean sprint speed at baseline. The results were:
Plyometric condition: p < 0.05
Control condition: p > 0.05
(c) Using the data, discuss the hypothesis that plyometric exercise can improve sprint performance.
*Mark scheme in hints but try to answer it first!
A study investigated the effect of plyometric exercise on sprint speed. (Plyometric exercise involves rapid and repeated stretching and contracting of the muscles.) The mean speed of each participant was measured during a 20 m sprint as a baseline and then in a further five 20 m sprints. During the first 75 seconds of the interval between sprints the participants carried out one of the following activities:
Plyometric: three sets of alternate leg bounds (running-like movement, jumping from one leg to the other consecutively)
Control: continuous walking.
The graph shows the mean sprint speed and positive standard deviation value for both conditions.
A paired t-test was conducted to compare mean sprint speed at 4 minutes with mean sprint speed at baseline. The results were:
Plyometric condition: p < 0.05
Control condition: p > 0.05
(d) Explain the reason for using a control condition in this study design.
*Mark scheme in hints but try to answer it first!
A study investigated the effect of plyometric exercise on sprint speed. (Plyometric exercise involves rapid and repeated stretching and contracting of the muscles.) The mean speed of each participant was measured during a 20 m sprint as a baseline and then in a further five 20 m sprints. During the first 75 seconds of the interval between sprints the participants carried out one of the following activities:
Plyometric: three sets of alternate leg bounds (running-like movement, jumping from one leg to the other consecutively)
Control: continuous walking.
The graph shows the mean sprint speed and positive standard deviation value for both conditions.
A paired t-test was conducted to compare mean sprint speed at 4 minutes with mean sprint speed at baseline. The results were:
Plyometric condition: p < 0.05
Control condition: p > 0.05
(e) Comment on the meaning of the results from the t-test.
Describe how a placebo can be used to blind a subject.
*Mark scheme in hints but try to answer it first!
Discuss the advantages and disadvantages of field testing compared to laboratory testing.
*Mark scheme in hints but try to answer it first!