Intro of Proportional Relationships Assessment
star
star
star
star
star
Posljednje ažuriranje almost 3 years ago
10
2
2
1
2
2
2
2
2
2
2
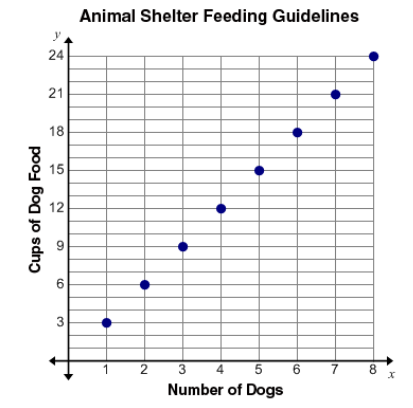
The above graph represents feeding guidelines at an animal shelter. What does the point (1,3) represent?
What is the constant of proportionality?
Write an equation that relates how many cups of dog food are needed to feed any number of dogs?
Which graph shows a proportional relationship?
The graph shows the cost in dollars of pounds of blueberries, a proportional relationship. Select all the true statements.
Andre rode his bike at a constant speed. He rode 1 mile in 5 minutes. Which of these equations represents the amount of time (in minutes) that it takes him to ride a distance of miles?
The two lines represent the amount of water, over time, in two tanks that are the same size. Which container is filling more quickly? Explain how you know.
The table shows the weights of apples at a grocery store.
Complete all three parts. Use the T (textbox) to type in your explanations. I labeled the axis for you. 😄


