Twa kɔ nsɛm atitiriw so
Log in
Sign up for FREE
arrow_back
Laabri

Copy of MRY Ch 3.5 Scatter Plots (11/7/2023)

star
star
star
star
star
Last updated over 2 years ago
13 Nsɛmmisa

Note:

Strong correlations have points very close to the line of best fit!

Weak correlations have points more spread away from the line of best fit!

No correlation does not have a line of best fit!

1
1
1
1
1
1
1
1
1
1
1
1
1
Asemmisa {{asɛmmisaAhyɛnsode}}
1.

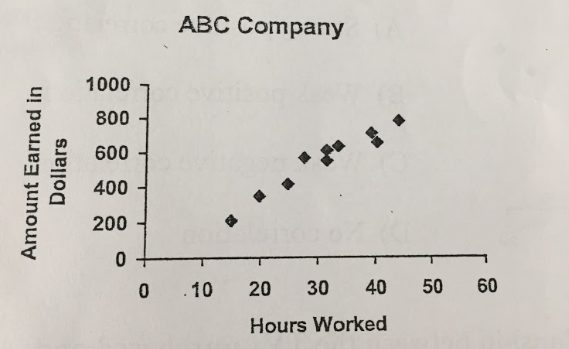
The scatter plot below shows a relationship between hours worked and money earned. Which relationship best describes the relationship between the variables?
Asemmisa {{asɛmmisaAhyɛnsode}}
2.

Which statement best describes the trend shown in the relationship from number 1?

Asemmisa {{asɛmmisaAhyɛnsode}}
3.

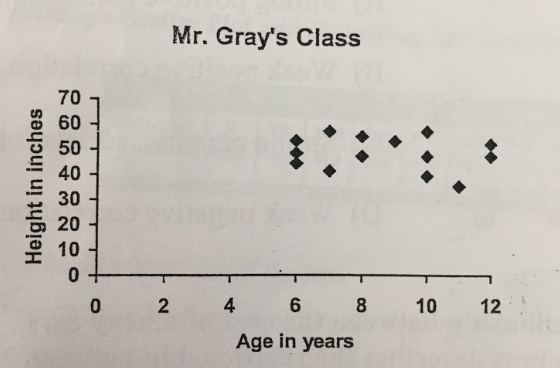
This scatter plot shows a relationship between age and height. Which best describes the relationship between the variables?
Asemmisa {{asɛmmisaAhyɛnsode}}
4.

Which statement best describes the trend shown in the relationship from number 3?

Asemmisa {{asɛmmisaAhyɛnsode}}
5.

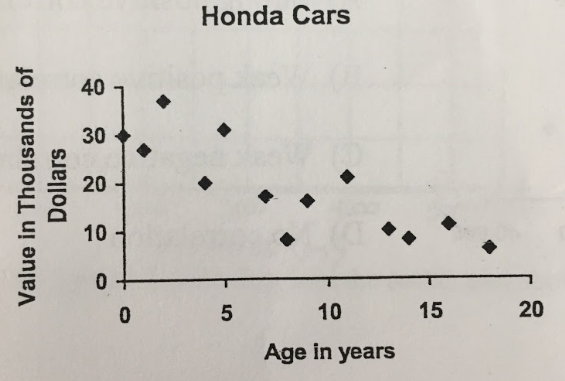
This scatter plot shows the relationship between the age of a car and its value. Which best describes the relationship between the variables?
Asemmisa {{asɛmmisaAhyɛnsode}}
6.

Which statement best describes the trend shown in the relationship from number 5?

Asemmisa {{asɛmmisaAhyɛnsode}}
7.

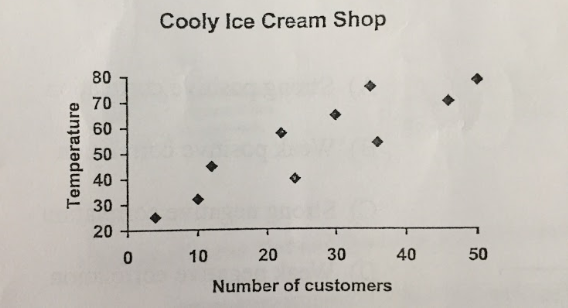
This scatter plot shows a relationship between the outdoor temperature and the number of customers in an ice cream store. Which best describes the relationship between the variables?
Asemmisa {{asɛmmisaAhyɛnsode}}
8.

Which statement best describes the trend shown in the relationship from number 7?

Asemmisa {{asɛmmisaAhyɛnsode}}
9.

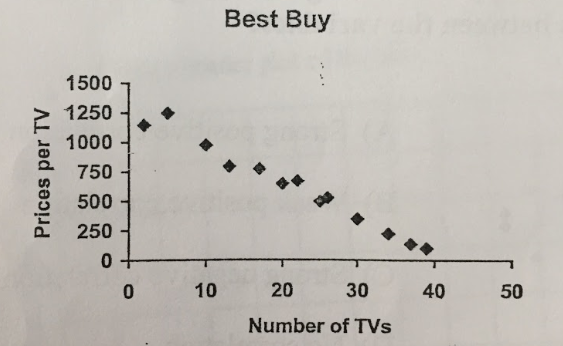
This scatter plot shows a relationship between the TVs purchased and prices. Which best describes the relationship between the variables?
Asemmisa {{asɛmmisaAhyɛnsode}}
10.

Which statement best describes the trend shown in the relationship from number 9?

Asemmisa {{asɛmmisaAhyɛnsode}}
11.

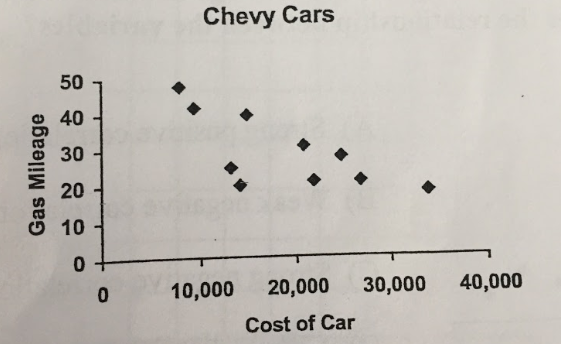
This scatter plot shows a relationship between the cost of Chevy cars and their gas mileage. Which best describes the relationship between the variables?
Asemmisa {{asɛmmisaAhyɛnsode}}
12.

Which statement best describes the trend shown in the relationship from number 11?

Asemmisa {{asɛmmisaAhyɛnsode}}
13.

Identify the data sets as having a positive, a negative, or no association.

  • The number of hours a person has driven and the number of miles driven.

  • The number of siblings a student has and the grade they have in math class.

  • The age of a car and the value of the car.

  • The number of weeks an album has been out and the total sales.

  • The number of years a person went to school and their income.

  • The number of apps downloaded on your phone and the amount of memory available.

  • The amount of time spent on your phone and the number of messages sent and received.

  • The age of a house and the number of people living in the house.

  • Positive Association

  • Negative Association

  • No Association