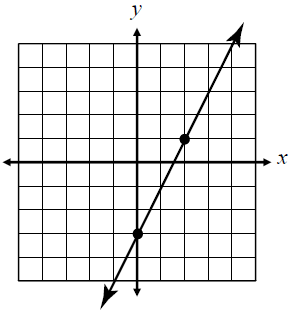
Given the graph, write the equation of the line in slope-intercept form.
y=
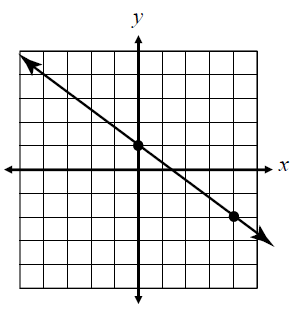
Given the graph, write the equation of the line in slope-intercept form.
y=
Given the graph, write the equation of the line in slope-intercept form:
Slope= , y-intercept=
Equation in slope-intercept form:
Write the equation below in slope-intercept form.
Write the equation below in slope-intercept form.
Given the point and slope, write the equation in slope-intercept form
(-5, -2); Slope= -1
y=
Given the point and slope, write the equation in slope-intercept form.
y=
Given the two points, write the equation in slope-intercept form. Arrange the steps in the correct order.
y=
Given the two points, write the equation in slope-intercept form. Arrange the steps in the correct order. (represent slope as a fraction)
y=
Write the Equation of the line that is parallel to
and passes through the point (-3,11).
y=
Write an equation of a line that is Perpendicular to the line below and passes through the given point.
The Perpendicular slope is and the y-intercept is ; therefore the equation of the line the equation of the line is .
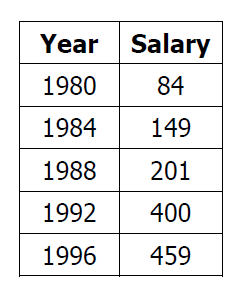
The table below shows the median salary (in thousands) of a football player. Using your calculator, find the equation for the line of best fit.
The table below shows the median salary (in thousands) of a football player. Using your calculator, find the equation for the line of best fit.
Using your equation from #11, estimate the median salary of a football player in 2012.
The table below shows the median salary (in thousands) of a football player. Which statement identifies the correlation coefficient between the two variables and the correct interpretation of the correlation coefficient as a measure of the strength of the linear association?
r=; the correlation coefficient indicates a, linear correlation