B13 | M8 (23-24)
star
star
star
star
star
Posljednje ažuriranje 9 months ago
4 questions
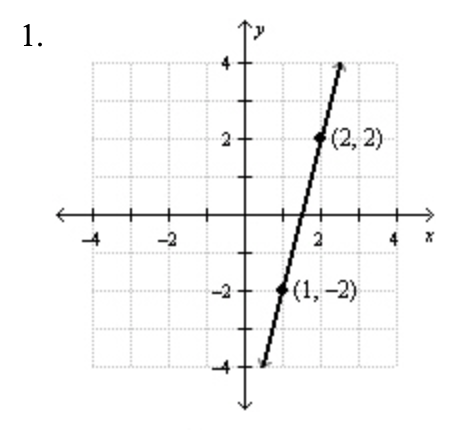
1
Find the slope of the line.
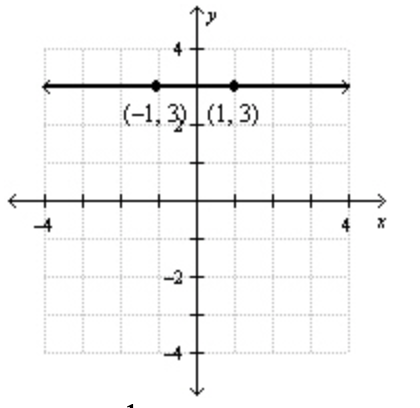
Find the slope of the line.
8.EE.6
1
8.EE.5
Find the slope of the line.
Find the slope of the line.

What is the slope represented in this table? Remember to reduce.
Graph the equation: