Preskoči na glavni sadržaj
Prijava
Sign up for FREE
arrow_back
Biblioteka

6.4 Exponential Regression

star
star
star
star
star
Posljednje ažuriranje over 1 year ago
16
Napomena autora:

OBJECTIVES & STANDARDS

Math Objectives

  • Use technology to find the exponential function that best fits a data set

  • Analyze how well a regression model fits a data set using r2 values

  • Use regression models to summarize trends and make predictions

Common Core Math Standards

  • Link to all CCSS Math

  • CCSS.HSS.ID.B.6.A

  • CCSS.HSF.LE.A.2

  • CCSS.HSF.LE.B.5

Personal Finance Objectives

  • Analyze long-term trends in the stock market

  • Use exponential regression to summarize trends for different portfolios, funds, and asset types

National Standards for Personal Financial Education

Investing

  • 3b: Investigate the long-run average rates of returns on small-company stocks, large-company stocks, corporate bonds, and Treasury bonds

DISTRIBUTION & PLANNING

Distribute to students

  • Student Activity Packet

  • Application Problems

Intro/Warm-Up:
Learn It
Practice It
Desmos:
Application Problems
Level 2
12

OBJECTIVES & STANDARDS

Math Objectives

  • Use technology to find the exponential function that best fits a data set

  • Analyze how well a regression model fits a data set using r2 values

  • Use regression models to summarize trends and make predictions

Common Core Math Standards

  • Link to all CCSS Math

  • CCSS.HSS.ID.B.6.A

  • CCSS.HSF.LE.A.2

  • CCSS.HSF.LE.B.5

Personal Finance Objectives

  • Analyze long-term trends in the stock market

  • Use exponential regression to summarize trends for different portfolios, funds, and asset types

National Standards for Personal Financial Education

Investing

  • 3b: Investigate the long-run average rates of returns on small-company stocks, large-company stocks, corporate bonds, and Treasury bonds

DISTRIBUTION & PLANNING

Distribute to students

  • Student Activity Packet

  • Application Problems

GRAPH: Fahad’s Investment

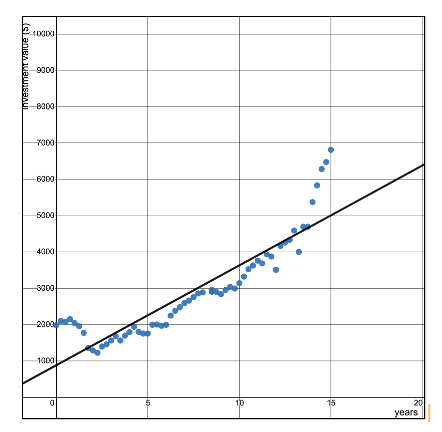
The data points below represent the value of Fahad’s investment account over the last 15 years. Fahad wants to summarize the trends in his account, so he finds the line of best fit.
1
Pitanje 1
1.

Based on his regression, Fahad wrote the equation for the line of best fit:

y = 275x + 881.

  1. What is the slope of the line of best fit?

  2. What does the slope represent in this scenario?

1
Pitanje 2
2.

Estimate Fahad’s investment value after 15 years…

a. Using the data points.

b. Using the line of best fit.

1
Pitanje 3
3.

Do you think the line of best fit gives you a good prediction? Why or why not?
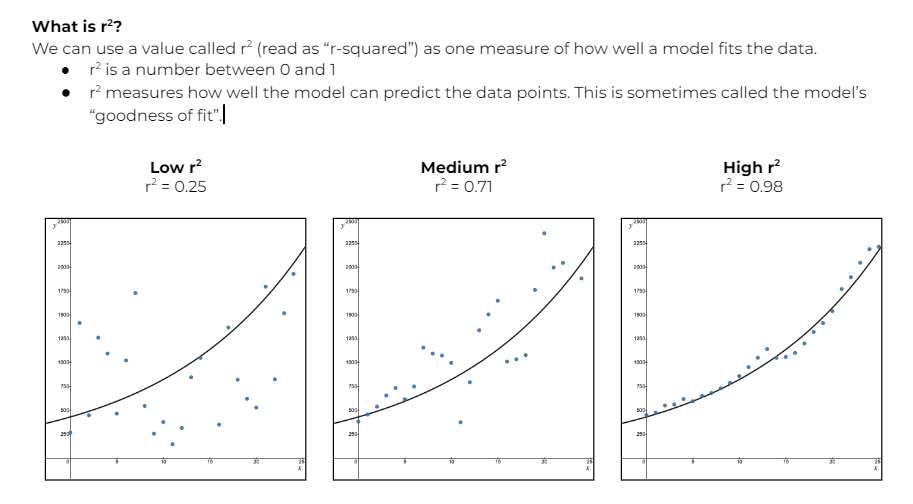
Measuring Goodness of Fit

We can measure how well a model, like Fahad’s line of best fit, matches the data points given by using a statistical measure called r squared

Read the notes below and answer the questions that follow.

1
Pitanje 4
4.

In your own words, what does r^2 (r squared) tell you?

1
Pitanje 5
5.

Summarize: Looking at a graph, how might you know if a model had an r squared value close to 1?

Part I:

Part II: Fahad’s Investments and r squared

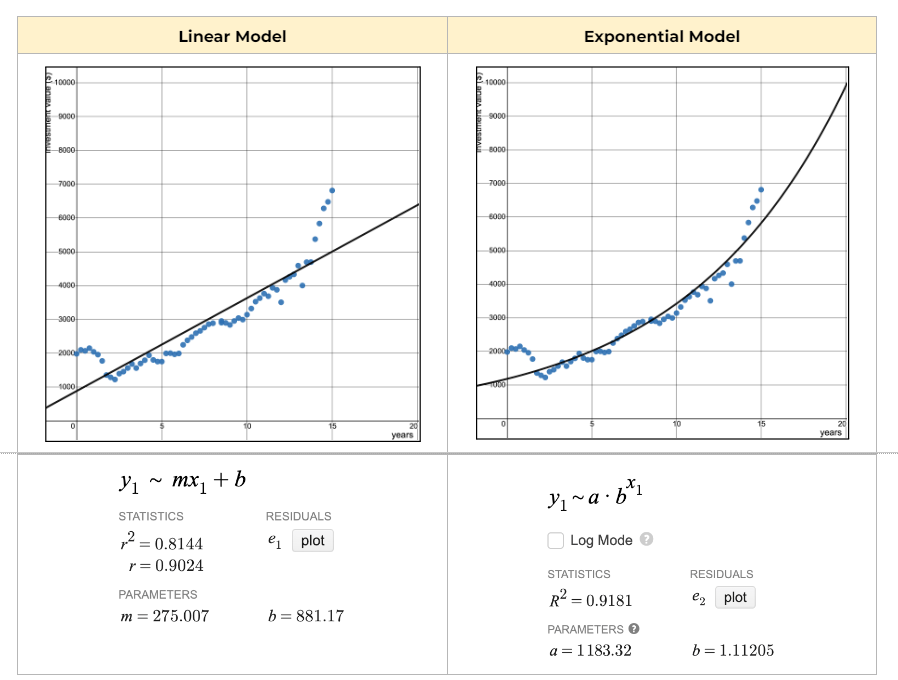
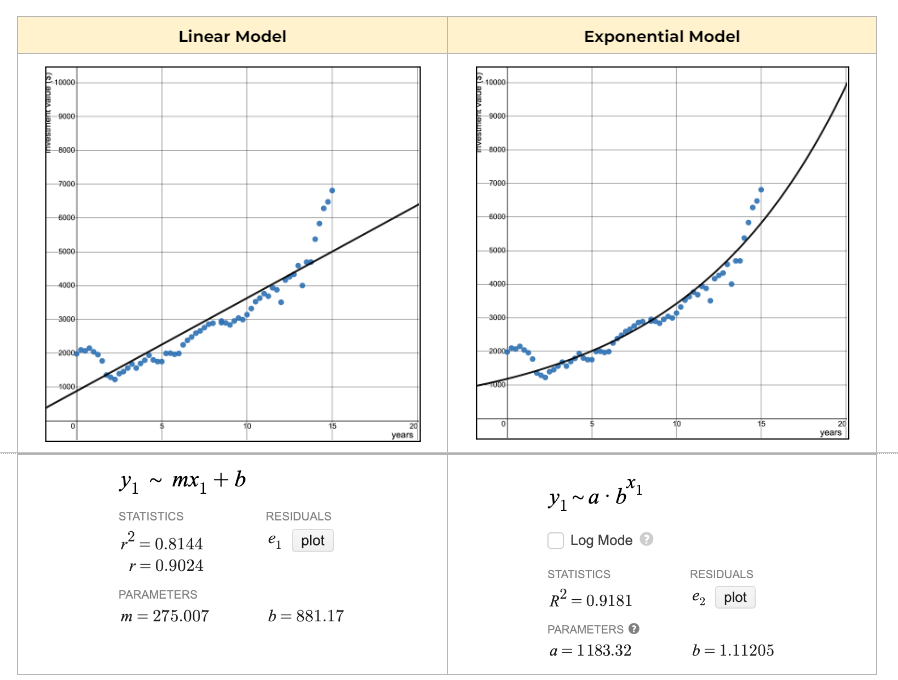
Let’s return to Fahad’s investment from the start of the lesson. Fahad used a linear regression model to explain his investment’s value, but we could also use an exponential model. Compare the models and answer the questions.

1
Pitanje 6
6.

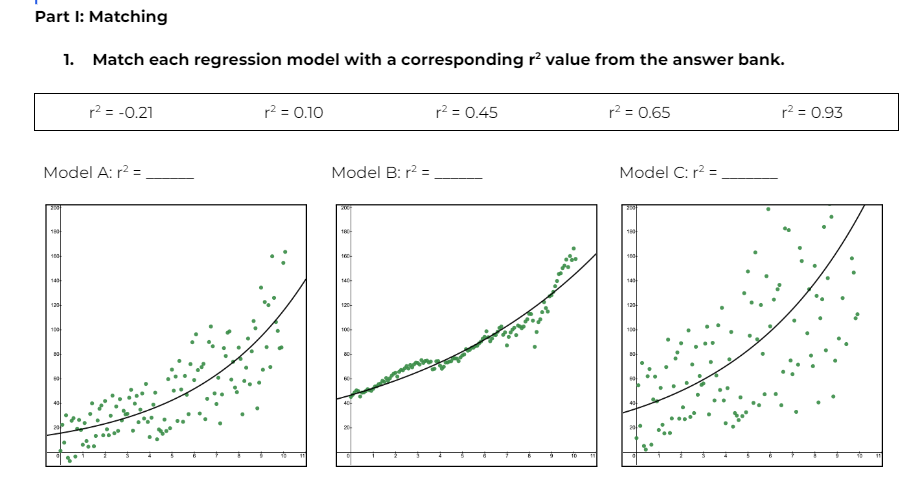
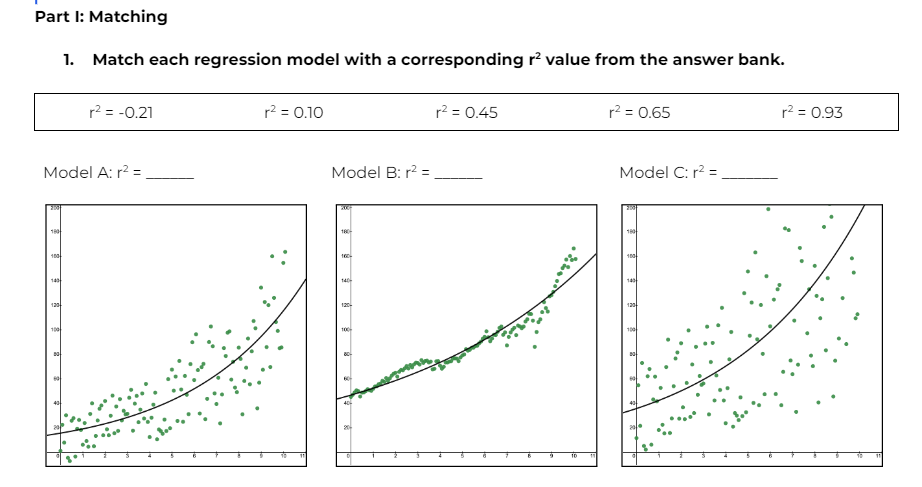
Part 1:

Model A

Model B

Model C

1
Pitanje 7
7.

What is the r^2 value of the linear model? What does that tell you?

1
Pitanje 8
8.

Write the equation for the exponential model by substituting in the provided values for a and b. Round to the nearest hundredth.

1
Pitanje 9
9.

Predict Fahad’s investment value after 20 years…

a. Using the linear model.y=

b. Using the exponential model.y=

1

DESMOS: Exponential Regression in Investing

Link in google classroom

In earlier lessons, you learned how to find the line that best fits a data set using a linear regression model. We can do the same thing with exponential functions. Follow your teacher’s instructions to complete this Desmos activity which will be graded separetly in X2.

Part I: Robo Advisors

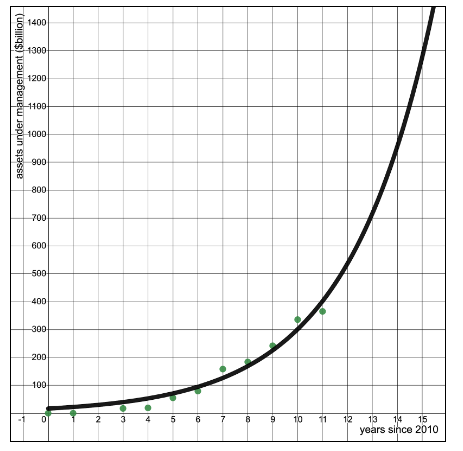
Robo advisors have been growing in popularity ever since they were first made available to the public approximately 15 years ago. The data points show how many billions of dollars were managed by robo-advisors each year since 2010 in the US. The curve is an exponential regression model for the data.

1
Pitanje 11
11.

Based on the model, approximately how many assets did robo advisors have under management in 2015? billion

1
Pitanje 12
12.

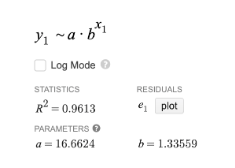
Here are the results of the exponential regression. Write the equation for the exponential model by substituting the values for a and b into the equation. Round to the nearest hundredth.

1
Pitanje 13
13.

Based on the regression, what is the average annual growth rate of robo-advisor’s assets under management? %

1
Pitanje 14
14.

Based on the exponential regression model, predict the assets under management for robo-advisors in 2025.

1
Pitanje 15
15.

Do you think this model provides an accurate prediction for the future? Why or why not?

Pitanje 16
16.

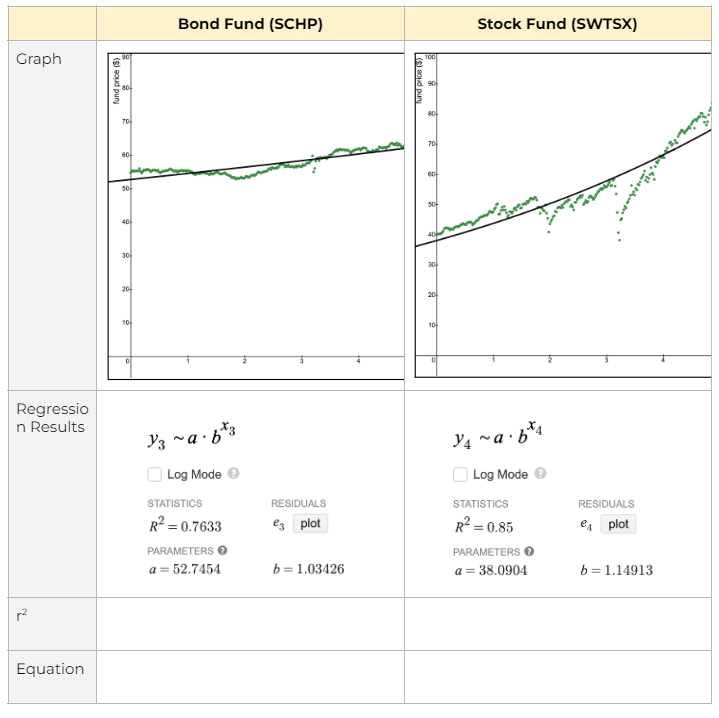
Complete the table by writing the equation and r2 values based on the regression results. Round to the nearest hundredth.

Bond Fund Stock Fund

Equation:

1. Based on the regression model, what is the average annual rate of return of the Stock Fund?

2. Amar decides to invest $100 in the Stock Fund. He learns it has a total expense ratio of 0.03%. Write an equation to model the predicted value of his investment after x years.

3. Based on the regression model, what is the predicted price of the Bond Fund after 15 years?

4. Why does the exponential function of best fit for the Bond Fund appear almost linear?

5. Which fund is more volatile? Explain your reasoning.

6. Which fund do you think would be a better long-term investment? Why?

Pitanje 10
10.

Which model is a better fit for the data set? Justify your response.