
The graph shows the number of student nurses over some years. Estimate the total number of students in 2008.
The graph shows the number of student nurses over some years. Estimate the total number of students in 2008.
Warm up Q: What is 25% of 200
Warm up Q: What is 10% of 400
Warm up Q: What is 5% of 400
The graph shows the number of student nurses over some years. Estimate the total number of students in 2008.
From the graph in Q4. Estimate the percentage of the total nursing students in 2008 who were male.
From the graph in Q4. In which year was the proportion of male students the highest?
How much liquid was produced in the first 7 hours? State your units.
From the graph in Q7. How much liquid was sampled each time for the quality control? State your units.
From the graph in Q7. What was the total amount of liquid produced by the reaction over the whole day? State your units.
This graph shows the share price of a company over a number of years. Describe what happens to the share price over these 4 years. Include:
The highest value.
The lowest value.
For each year if it was increasing / decreasing / stayed the same.
Any other information you can see.
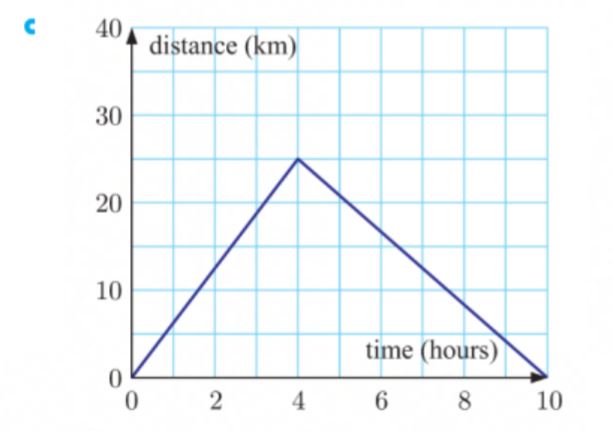
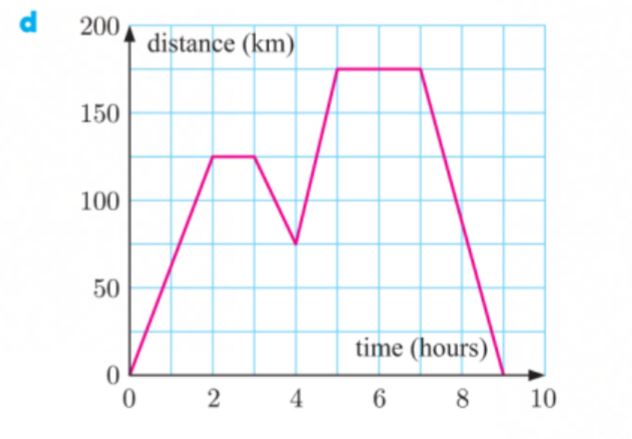
There are three main routes from Geneva to Lausanne.
Match each graph with the appropriate route description.
| Stavka koja se može prevući | arrow_right_alt | Odgovarajuća stavka |
|---|---|---|
A winding road which requires travel at a constant slower speed. | arrow_right_alt | c |
Main roads with 60km/h speed limits and multiple traffic lights. | arrow_right_alt | b |
A highway with a 110km/h speed limit, a stop at a train crossing, then an 80km/h speed limit main road. | arrow_right_alt | a |
Wingyi walks for 30 minutes from her home to the post office which is 3km away.
She waits in line for 15 minutes, then walks home, taking 45 minutes.
Draw a travel graph to illustrate her journey - don’t forget to label the axis.
State your units
State your units
State your units
State your units. Type your answer like this:
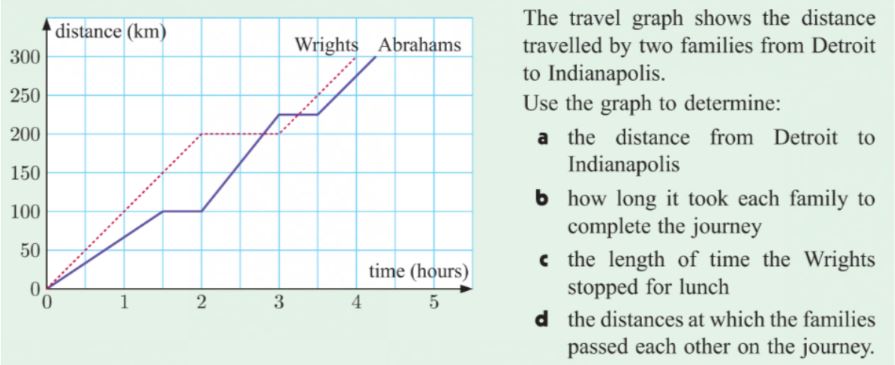
W=?, A=?
State your units.
State your units.
Give an advantage of using a graph to display data.
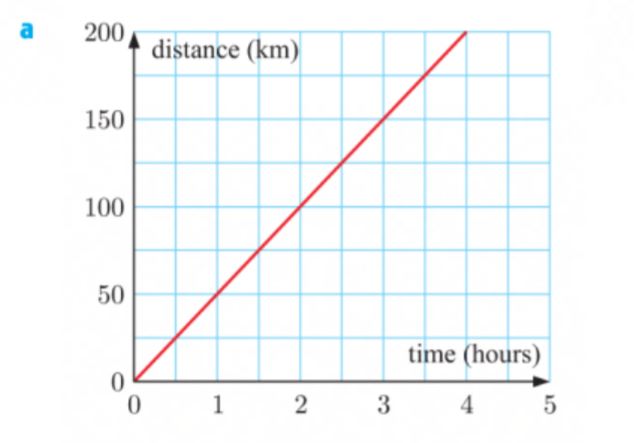
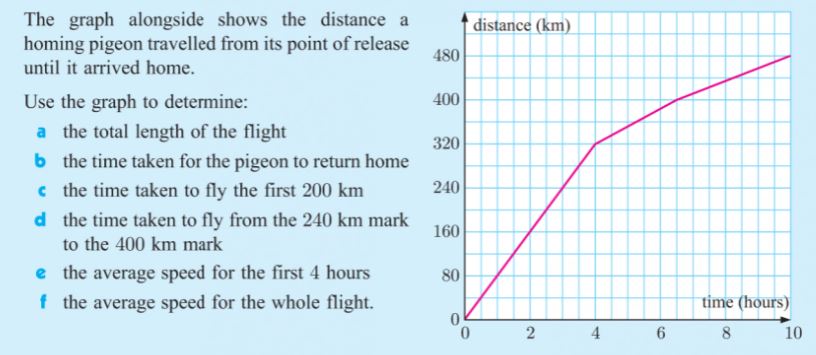
What is the total distance travelled?
What is the average speed for the whole trip?
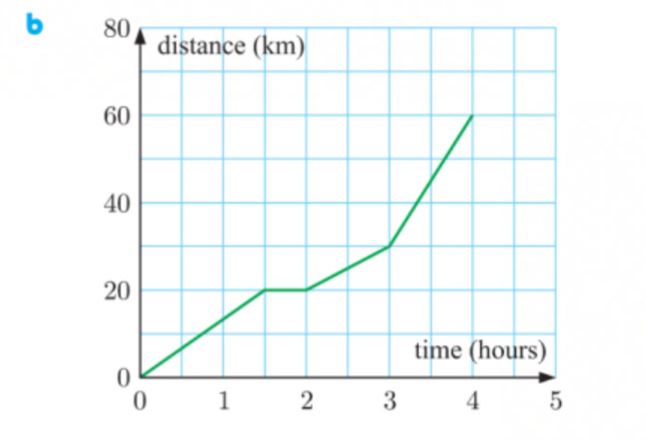
What is the total distance travelled?
What is the average speed for the whole trip?
What is the total distance travelled?
What is the average speed for the whole trip?
What is the total distance travelled?
What is the average speed for the whole trip?
State your units
State your units
State your units
State your units


