Let's take another look at the test score data from last lesson.
The Dotplot below represents a random sample of 20 scores from the Chapter 1 Test (Skill #1)


Let's take another look at the test score data from last lesson.
The Dotplot below represents a random sample of 20 scores from the Chapter 1 Test (Skill #1)
Alice scored 3.8. What is Alice's percentile?
Percentile is one way of describing the location of a data point. Another way is by comparing the data point to the mean and standard deviation.
Is Alice's score above or below the mean? By how many points?
The standard deviation measures the typical distance of the values in a distribution from the mean.
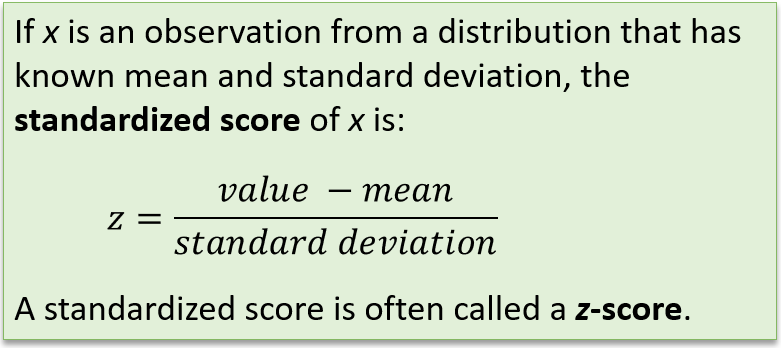
How many standard deviations above or below the mean did Alice score? You can calculate this with the following formula:
Mac scored a 1.5 on this skill. How many standard deviations above or below the mean did Mac score?
The numbers you calculated in questions 3 and 4 are called the Z-Score or Standardized Score.
What does it mean if a z-score is positive? How about if it is negative?
Henry's z-score is equal to 0.8. Interpret the z-score.
In AP Statistics, you will often be asked to interpret numbers. That means you should explain the context of the number and what it means in plain english.
There are two mathematical operations used when calculating a z-score. Let's explore what happens to data when you transform it in different ways.
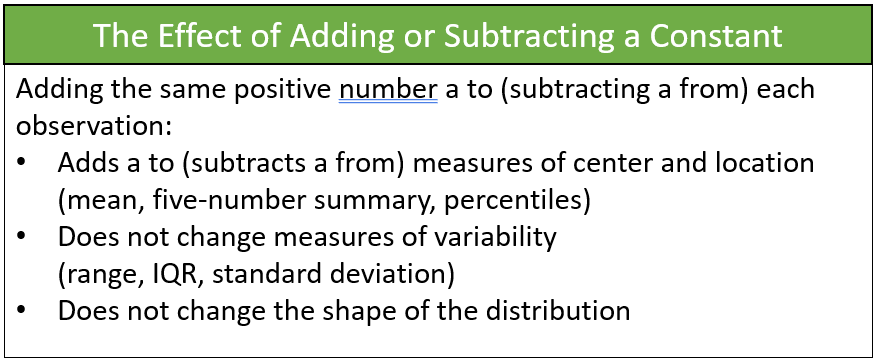
First, we take each score and subtract the mean (use 3.2 as the mean).
Fill in the table below. Then create a dot plot of Score-Mean to compare with the original.
Looking at the two dot plots, what happens to the shape of our distribution when you subtract the mean from each score?
Calculate the mean of the new distribution (score-mean). How does the center of our new distribution (the new mean) compare with the old one?
Looking at the two dot plots, what happens to the variability (the spread of data/distance between data points) of our distribution when you subtract the mean from each score?
Let's explore the second operation involved with z-scores: Division.
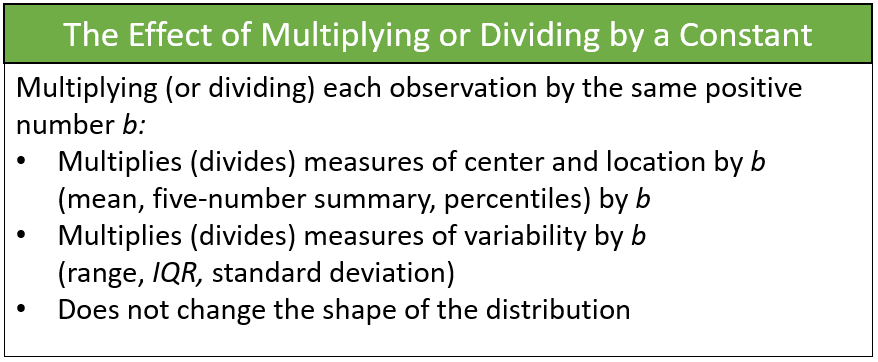
Take the values you got from score-mean and divide by the standard deviation (use .7 as the standard deviation). Round to 1 decimal place.
Fill in the table below. Then create a dot plot of (Score-Mean)/(Standard Deviation) to compare with the dotplot for (Score-Mean)
Looking at the two dot plots, what happens to the shape of our distribution when you divide by the standard deviation?
In statistics, two distributions have can have the same shape even if the scale is different.
Calculate the mean of the new distribution (score-mean)/standard deviation. How does the center of our new distribution (the new mean) compare with the old one (for score-mean)?
Looking at the two dot plots, what happens to the variability (the spread of data/distance between data points) of our distribution when you divide the standard deviation?


Are there any problems above that you would like to go over in class? Indicate the question numbers below (Numbers refer to the Formative question number). I'll try to cover anything that is highly requested.