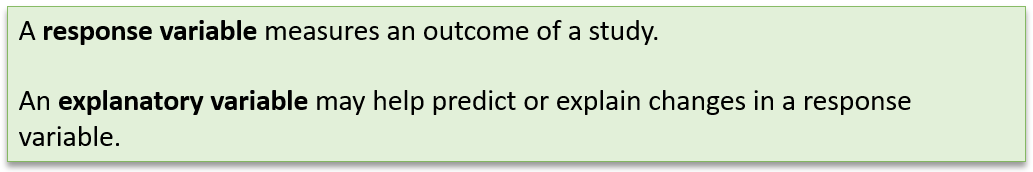
Identify the explanatory variable and response variable for the following relationships, if possible. Explain your reasoning.
(a) The score on a statistics final exam and the number of hours studied for a sample of students
(b) The weight and the price for a sample of diamonds
(c) The final exam score for statistics and the final exam score for biology for a sample of students taking both courses
You are given the following data representing the number of hours students spend studying for an exam and their corresponding exam scores:
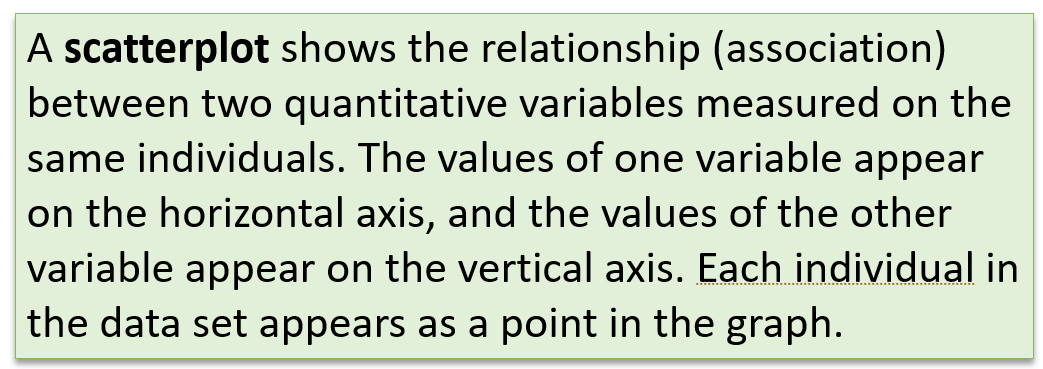
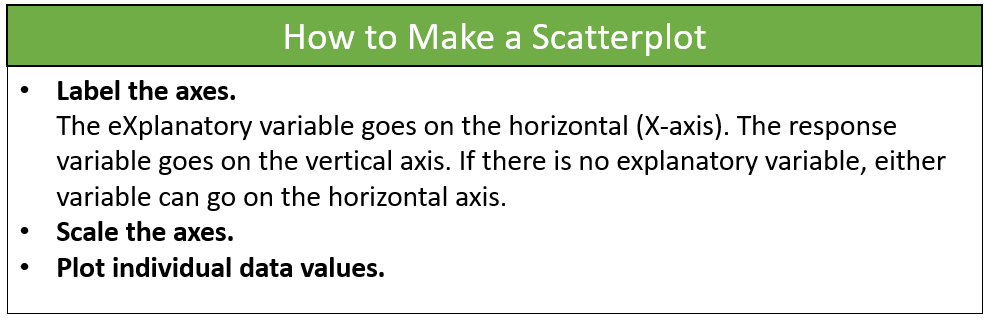
Create a scatter plot for this data. Make sure to label your axes appropriately
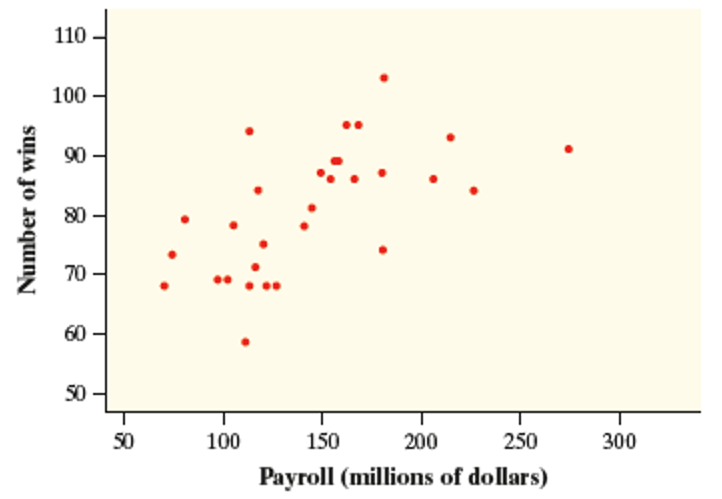
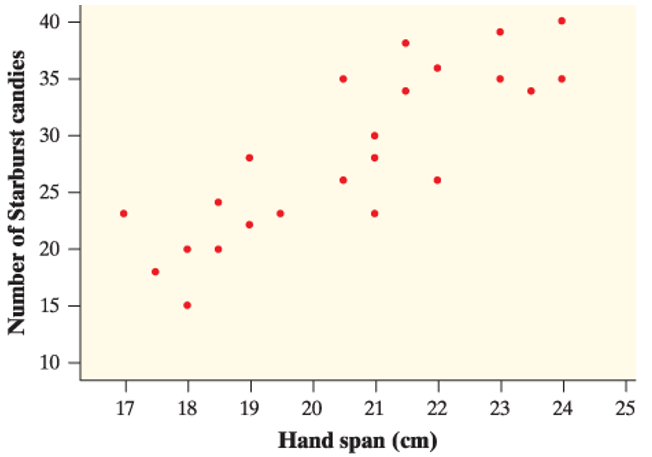
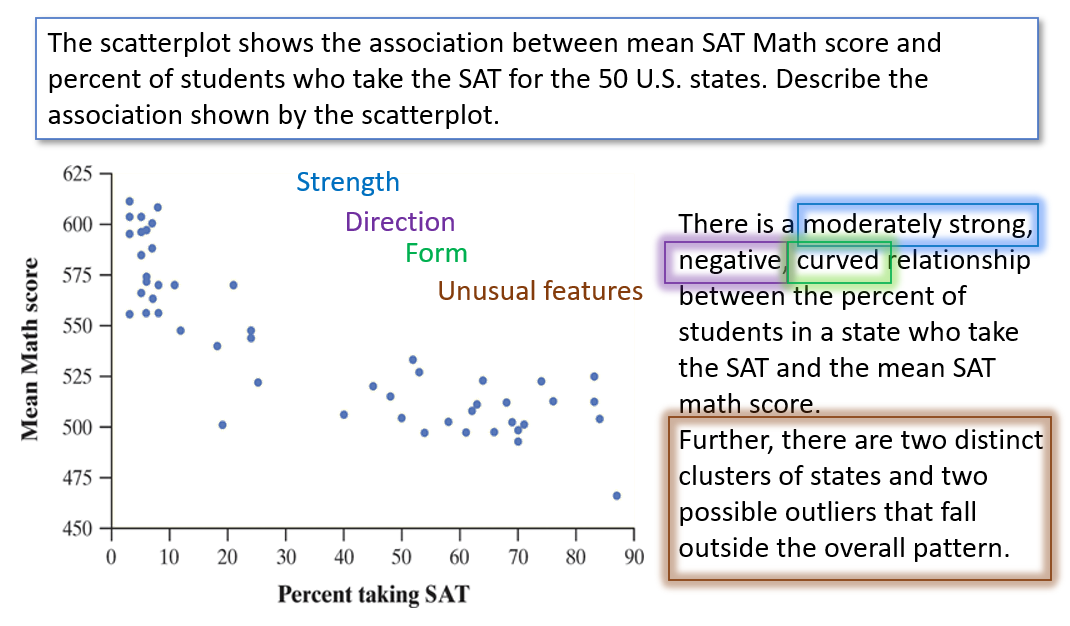
What type of association is shown in the scatterplot below?

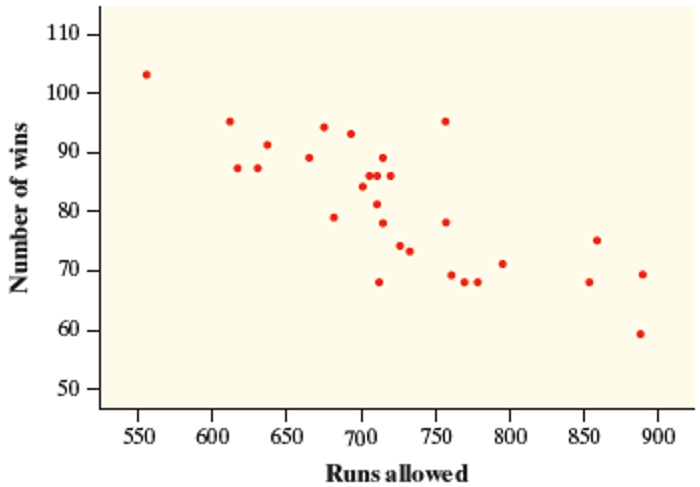
What type of association is shown in the scatterplot below?

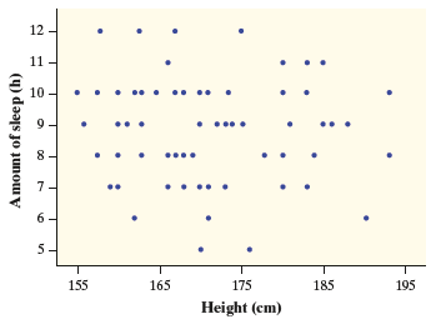
What type of association is shown in the scatterplot below?


Are there any problems above that you would like to go over in class? Indicate the question numbers below (Numbers refer to the Formative question number). I'll try to cover anything that is highly requested.