What has most likely occurred in this area?
Which of the following conditions would most likely cause precipitation?
At 8:00 AM the temperature is 75°F with low humidity and cirrus clouds in the sky. Predict what the weather will most likely be at 4:00 PM.
Brutus notices that the clouds outside his window are like a gray blanket filling in the sky. The clouds are dark, low, and thick. Should Brutus plan a picnic outside today and why?
Which combination of barometric pressure and temperature would most likely predict snow?
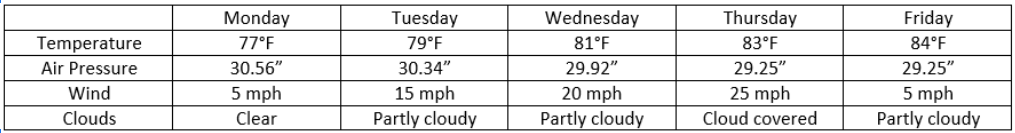
On which day will it most likely rain and what type of front may be anticipated for that day?
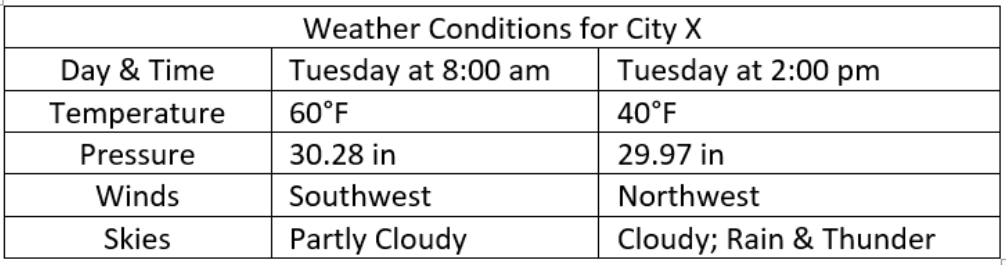
Which combination of barometric pressure and temperature would most likely predict a thunderstorm?
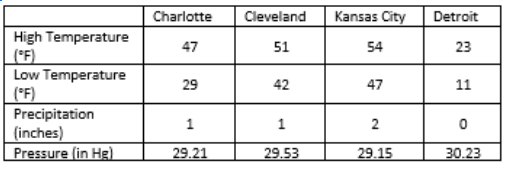
Based on the table, which city is most likely experiencing a cyclone?
In which city below did it probably snow?
Which city was most likely experiencing an anticyclone (high pressure system)?