Human Population Growth
star
star
star
star
star
Last updated about 1 year ago
6 Nsɛmmisa
1
1
1
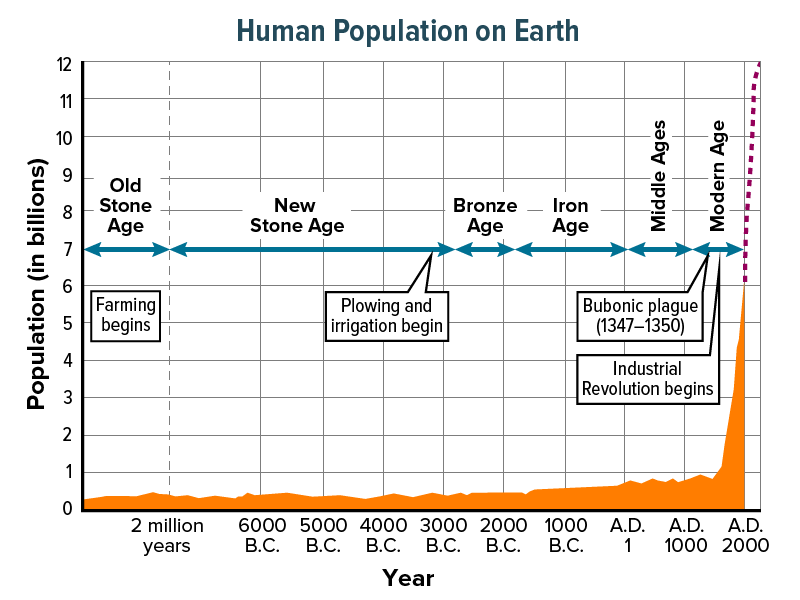
The study of human population size, density, distribution, movement, and birth and death rates is demography. The graph shown gives us the estimated human population for several thousand years.
Notice that the graph shows a relatively stable number of individuals over thousands of years--until recently.
You can see the recovery of the population after the outbreak of the bubonic plague in the 1300s. It's estimated that 1/3 of the population of Europe died from the bubonic plague.
In 1804, the human population of Earth was estimated to be 1 billion people. By 1999 our population was recorded at 6 billion people. With a current growth rate of just over 80 million people per year, we are expected to reach a population of 8 billion by 2025 and 9 billion by 2050.
Technological Advances
For thousands of years, environmental conditions kept the size of the human population at a relatively constant number. That number was below the environment's carrying capacity.
But now, humans have learned how to alter the environment in ways that appear to have changed the carrying capacity. Agriculture and domestication of animals have increased the human food supply. Technological advances and medicine have improved the chances of human survival by reducing the number of deaths from parasites and disease. In addition, improvements in shelter have made humans less vulnerable to climate.
Human Population Growth Rate
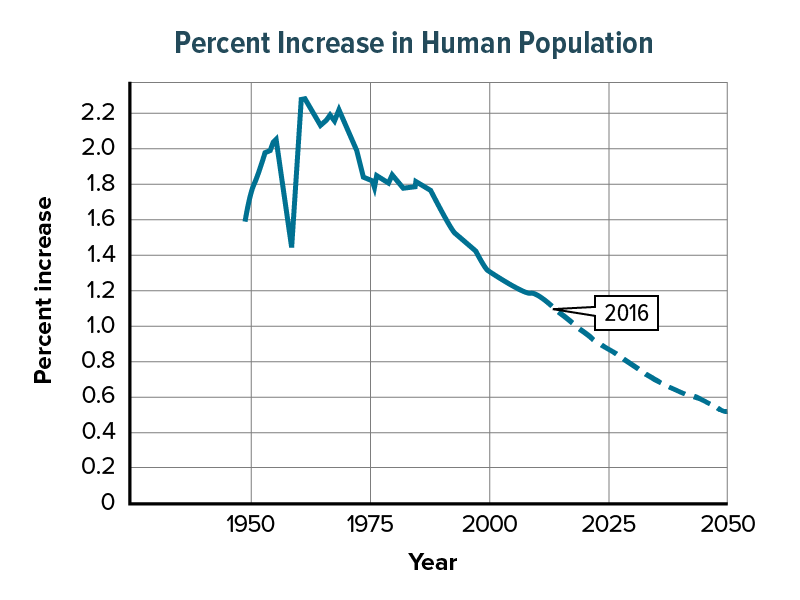
Although our population is still growing, our human population growth rate has slowed. The graph shown represents the PGR from the late 1940s through 2009. It also includes projected PGR through 2050.
Notice the drastic dip in population in the 1960s: this is primarily due to famine in China where about 60 million people died.
Human population growth rate has increased over time.
What has happened to the human population growth rate in recent years?
Technological advances have allowed humans to change the carrying capacities of our environments & increase our population.
Trends in Human Population Growth
Population trends can be altered by events such as disease and war. Population growth is not the same in all countries. Different abiotic and biotic factors can be occurring in different places. However, population growth trends are often similar in countries that have similar economies.
For example, one trend that has developed during the previous century is a change in the population growth rate in industrially developed countries like the United States. An industrially developed country is advanced in industrial and technological capabilities and has a population with a high standard of living.
Finding the PGR
Use this formula to answer the questions on the right.
Calculate the PGR for the United States using the following information.
Birthrate: 14.1
Death Rate: 8.3
Migration Rate: 2.9
Calculate the PGR for Honduras using the following information.
Birthrate: 26.9
Death rate: 5.4
Migration rate: -1.3
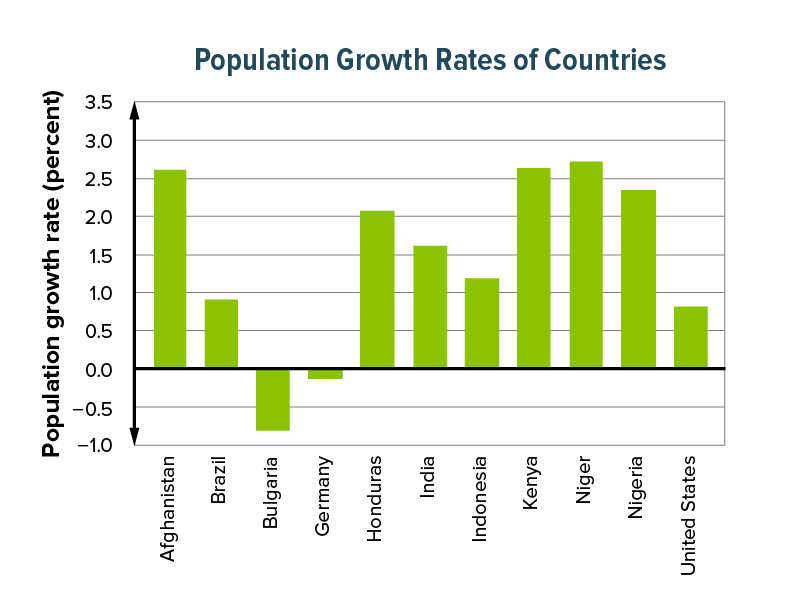
The graph pictured shows the PGR of different countries.
Generally developing countries will add more people to the world compared to industrially developed countries.
For example: the developing country Niger is expected to be one of the fastest growing countries between now and 2050. It's population is expected to expand from 13 to 53 million people.
On the other hand the developed country Bulgaria is expected to have a population decline from 7 to 5 million people in the same time period.
Which countries have a declining population?