Hail Storm in Fort Scott, Kansas
star
star
star
star
star
Last updated over 2 years ago
6 Nsɛmmisa
Hyɛ no nsow a efi ɔkyerɛwfo no hɔ:
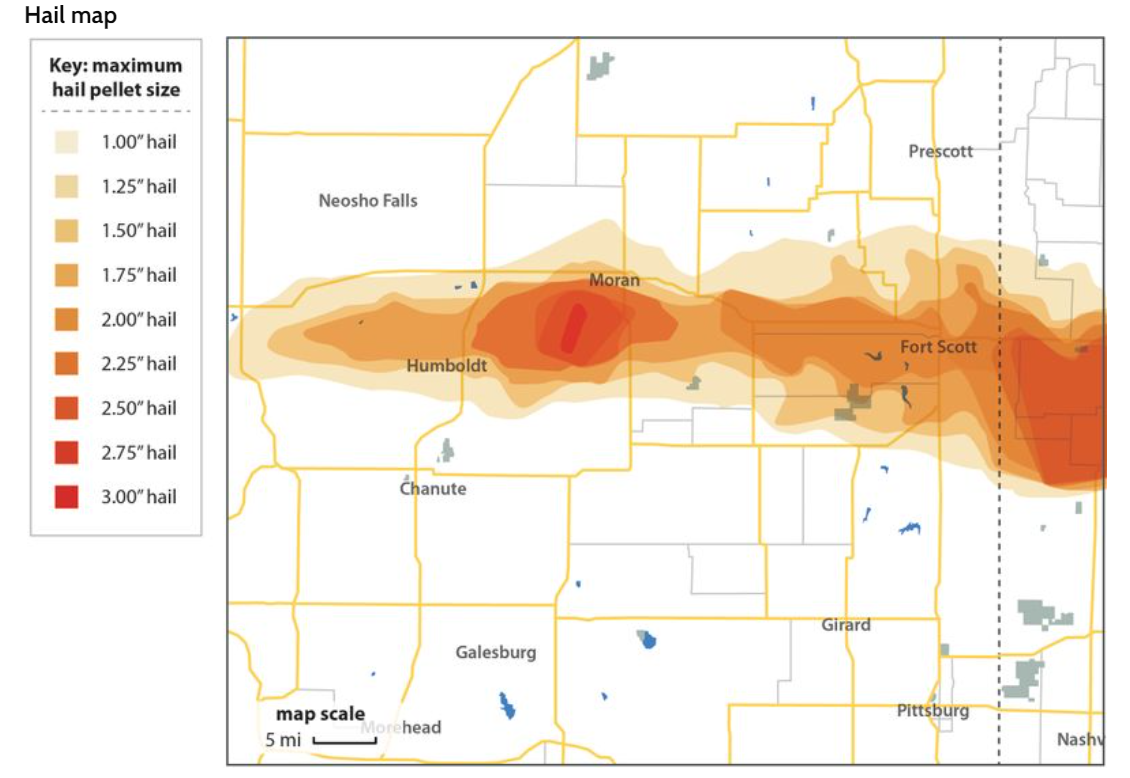
OpenSciEd 6.3 Lesson 2 - Fort Scott Data
1
1
1
1
1
1
OpenSciEd 6.3 Lesson 2 - Fort Scott Data
Explain what the different colors on the map mean.
From looking at the map, where do you think the storm was the strongest?
Why did you choose that location?
On the table below, highlight or circle when the strongest winds were.
On the table below, highlight or circle when the temperature changed the most dramatically.
What time do you think the storm happened? Explain your evidence.