B15 | Math 8
star
star
star
star
star
Posljednje ažuriranje over 1 year ago
12
0.25
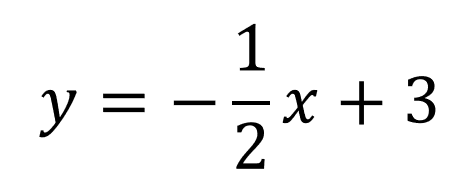
Write the number that represents the slope.
Write the number that represents the slope.
0.25
0.5
Write the number that represents the slope.
Write the number that represents the y-intercept
Graph the line.
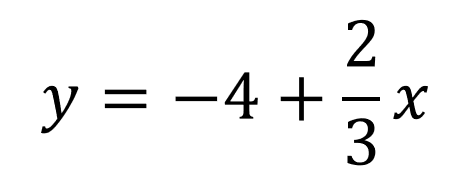
Write the number that represents the slope.
Write the number that represents the y-intercept.
Graph the line.
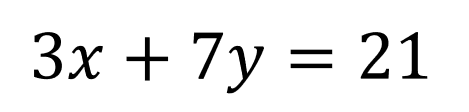
Write the number that represents the y-intercept.
Write the number that represents the x-intercept.
Graph the line.
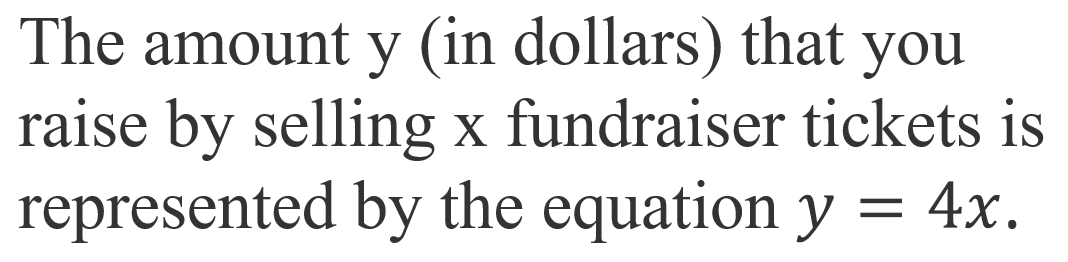
Write the number that represents the slope.
Write the number that represents the y-intercept.
Graph the line.