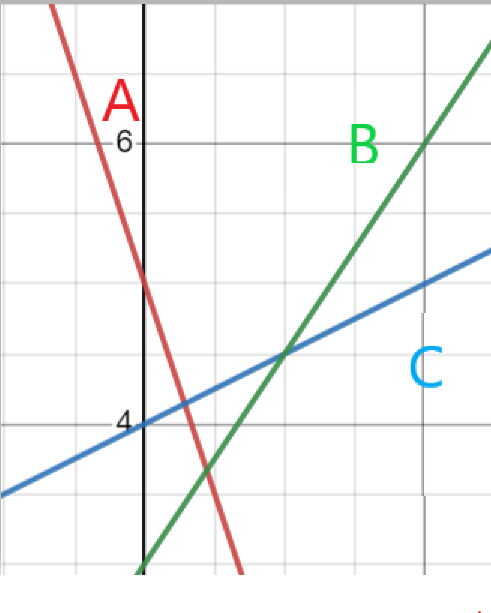
Find the slope of each line.
Slope of Line A?
Slope of Line B?
Slope of Line C?
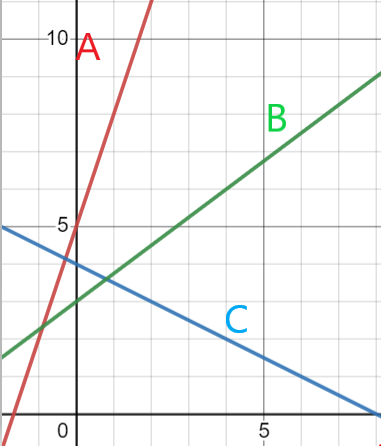
Find the slope of each line.
Slope of Line A?
Slope of Line B?
Slope of Line C?
Karen owns 3 dogs. Her dogs eat a lot of food! She bought 150 pounds of dogfood and in 10 days she only had 20 pounds of dogfood left.
What is the rate of change?
What is the initial value?
Write an equation to represent pounds (y) after (x) days.
Is this a proportional relationship?
What is the slope?
What is the y-intercept? List as an ordered pair.
Write an equation to represent the relationship.
Is this a proportional relationship?
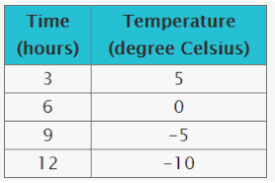
The average temperatures in Quebec, Canada is -30 degrees and gets 5 degrees warmer each hour.
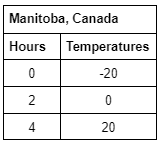
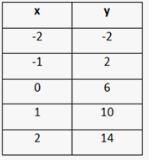
The temperatures in Manitoba, Canada are displayed in the table below.
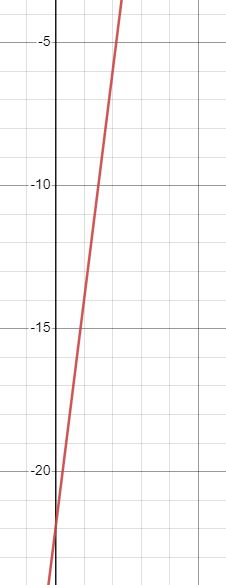
The temperatures in Ontario, Canada are displayed in the graph below.
Which town has the greatest rate of change?
Which town has the lesser initial value?
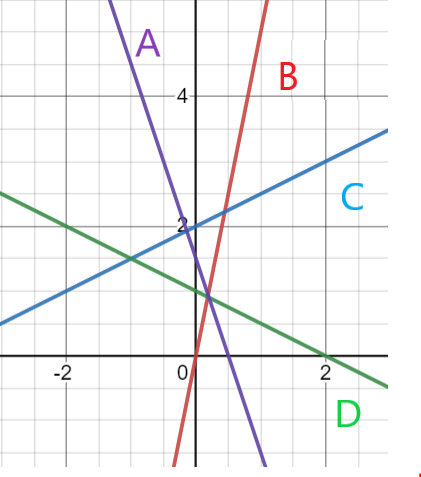
Without calculating the slope, match the following slope values with the appropriate line.
| Draggable item | arrow_right_alt | Corresponding Item |
|---|---|---|
-1/2 | arrow_right_alt | Line A |
-3 | arrow_right_alt | Line B |
5 | arrow_right_alt | Line C |
1/2 | arrow_right_alt | Line D |
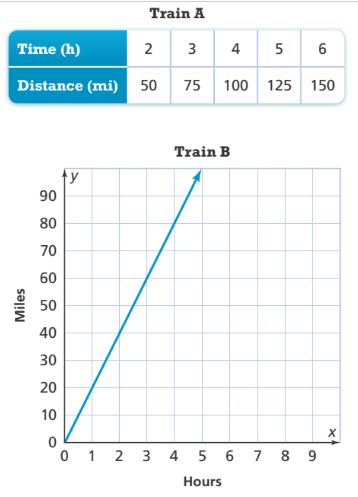
Three trains are traveling at a constant rate and are represented in the table graph and equation below.
Train C is represented by the equation y=15x
Which train is traveling the fastest?
Which train is traveling the slowest?
Are these relationships proportional?
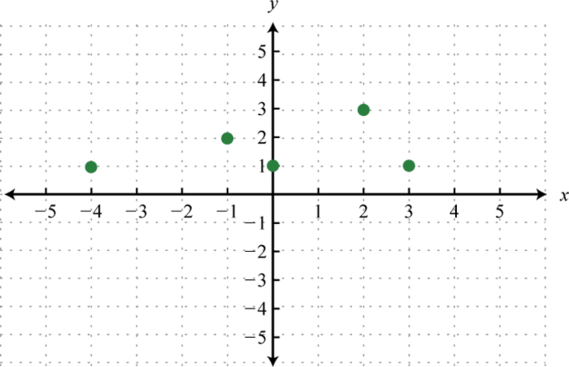
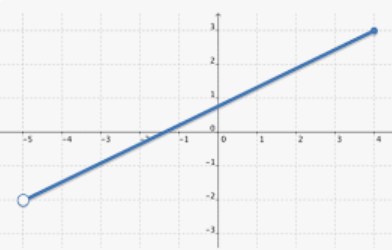
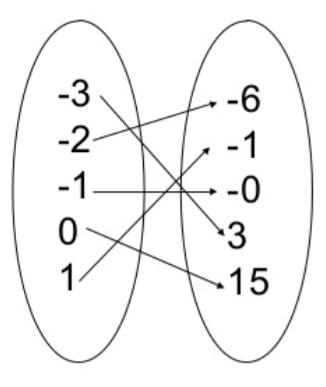
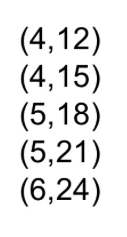
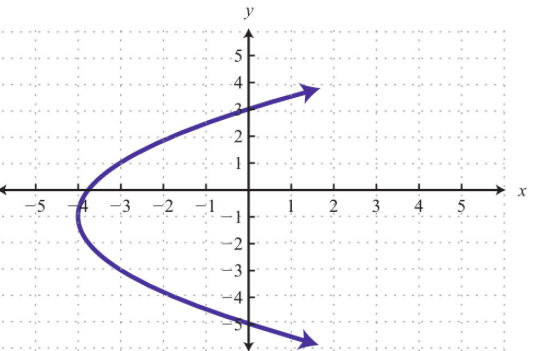
Select all models that represents a function.
A)
B)
C)
D)
E)
What is the domain and range?
Is the graph a function?
Is the graph proportional?
Which graph describes the situation?
Ben walked with a friend to a gas station close to his home to get a soda. He and his friend talked to some classmates at the gas station for a few minutes, and then the classmates drove Ben and his friend back to Ben's house. They got to Ben's house faster in the car then when they walked.

Which interval is the graph decreasing by a constant rate of change?
Which interval has no rate of change?
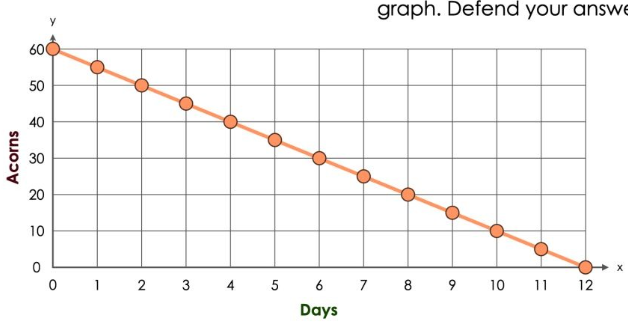
The graph below shows how many acorns are on the tree in my yard.
What does the slope mean in context of this graph?
What does the y-intercept represent in context of the graph?
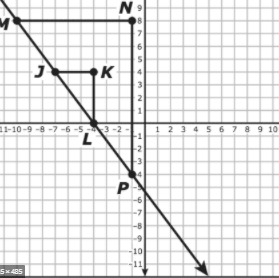
What is the slope of the line containing line segment MP?
What is the slope of the line containing line segment JL?
Explain the relationship between line segments MP and JL?.
The ordered pair (6, y) defines the location of point F, which is also on line MP. What is the value of y for this ordered pair?
Order the lines from flattest to steepest slope.