Twa kɔ nsɛm atitiriw so
Log in
Sign up for FREE
arrow_back
Laabri

Analyzing Visualizations of Data

star
star
star
star
star
Last updated over 2 years ago
7 Nsɛmmisa
Reading a bar graph
Ɛhia
1
MS-ESS2-5
Ɛhia
1
MS-ESS2-5
Ɛhia
1
MS-ESS2-5
Ɛhia
1
MS-ESS2-5
Reading data on a map
Ɛhia
1
MS-ESS2-6
Ɛhia
1
MS-ESS2-6
Ɛhia
1
MS-ESS2-6
Asemmisa {{asɛmmisaAhyɛnsode}}
1.

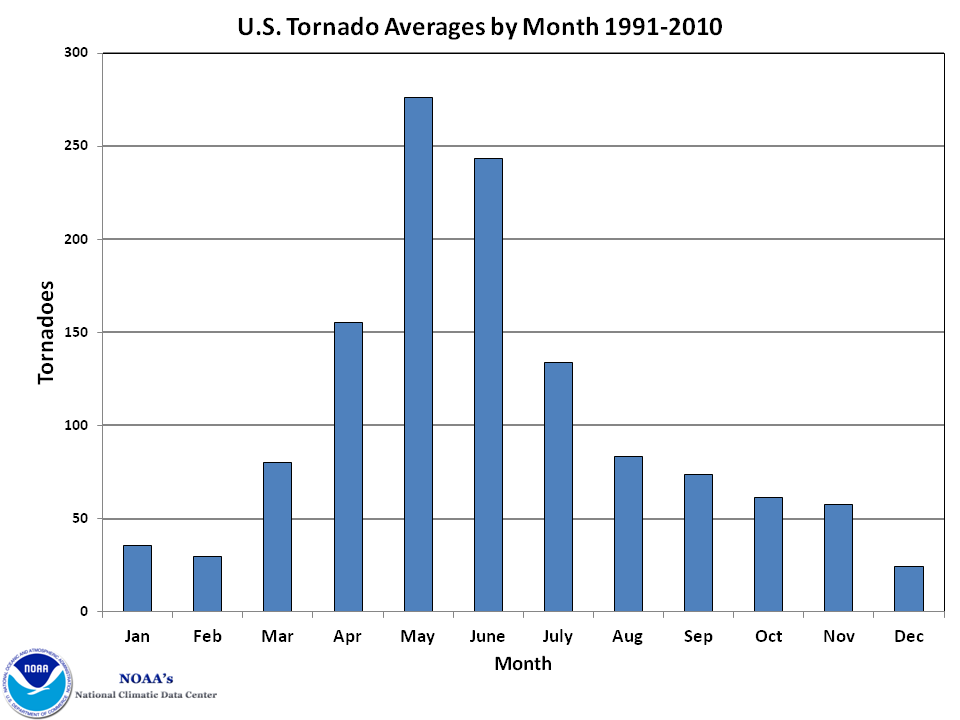
What does this graph show?

Asemmisa {{asɛmmisaAhyɛnsode}}
2.

According to this graph, the number of tornadoes increases in the fall (Sept.-Nov.)

Asemmisa {{asɛmmisaAhyɛnsode}}
3.

The greatest number of tornadoes in the US tends to occur in May.

Asemmisa {{asɛmmisaAhyɛnsode}}
4.

According to the graph, what is the average number of tornadoes in the US in April?

Asemmisa {{asɛmmisaAhyɛnsode}}
5.

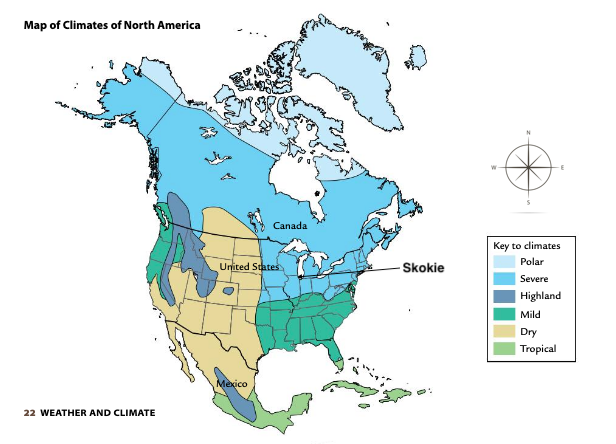
What is the climate in the most southern part of Mexico?

Asemmisa {{asɛmmisaAhyɛnsode}}
6.

What is the climate in Skokie?

Asemmisa {{asɛmmisaAhyɛnsode}}
7.

What climates exist on the western coast of the United States?