Unit G #2
star
star
star
star
star
Posljednje ažuriranje over 2 years ago
10
Napomena autora:
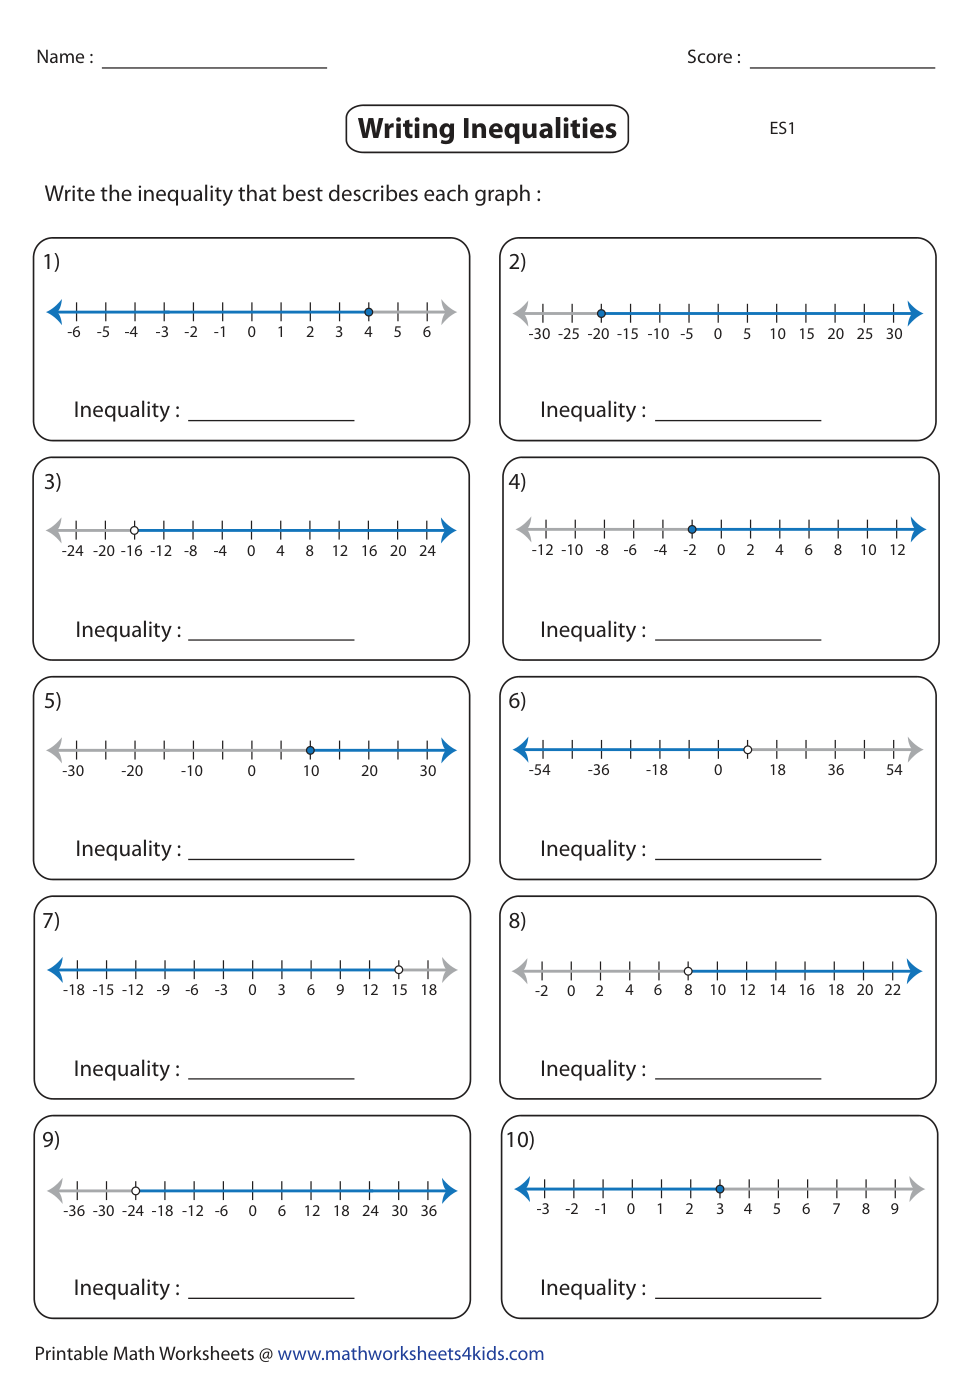
Write the inequality that best describes each graph. Use x as the variable.
Write the inequality that best describes each graph. Use x as the variable.
Write the inequality that best describes each graph. Use x as the variable.
Write the inequality that best describes each graph. Use x as the variable.