
Please read the questions carefully. Take your time. When you have questions, please let me know. You will have 65 minutes to work on this. Good luck. You got this!
A vector describes a quantity's ________ and ________.
A ______ is a place or object to which you compare to in order to determine motion.
_____ is a change in position over time.
An object with balanced forces acting on it would ________.
Displacement is the total distance traveled during an event. (Explain if false, or rewrite the statement to make it true. Use the "Show your work" feature.)
A force is defined as a
Applied force and spring force are both examples of noncontact forces. (Explain if false, or rewrite the statement to make it true. Use the "Show your work" feature.)
If the above vector diagram (from PhET, drip) represented someone's traveled path as shown by vectors a, b, and c, what distance did this person travel (in meters)?
If the above vector diagram (from PhET, drip) represented someone's traveled path as shown by vectors a, b, and c, what was that person's total displacement (in meters)?

Which of the above vector diagrams would best represent an airplane traveling into the wind (headwind)?
If the net force on an object is 0 Newtons, then the forces acting on this object are _________.
On time/distance graphs, the x-axis should always represent time. (Explain if false, or rewrite the statement to make it true. Use the "Show your work" feature.)
On a time/distance graph, the y-axis represents the reference point. (Explain if false, or rewrite the statement to make it true. Use the "Show your work" feature.)

Of the three graphs above, which one represents an object moving at an uniform (constant) speed? NOTE: position is the same as distance
Of the three graphs above, which one represents an object not moving? NOTE: position is the same as distance
Of the three graphs above, which one shows acceleration happening? NOTE: position is the same as distance

Based on the graph above, of the three objects moving, which one is moving the slowest?
On a time/distance graph, the slope represents ________.

The above graph shows Mr. Siegel traveling from his home to the PhET merch store. During what time listed was Mr. Siegel most likely on a break during this trip?
The above graph shows Mr. Siegel traveling from his home to the PhET merch store. Based on the graph, how far is the PhET merch store from Mr. Siegel's home?

From the above graphs, what was the total distance traveled?
From the above graph, which story best represents the graph?
______ is how fast something is traveling in a specific direction.
To find the numerical value that represents the velocity of an object, you must ________.
A

Based on the above velocity/time graph, which object is at rest?
Based on the above velocity/time graph, which object is moving at a constant velocity?
Based on the above velocity/time graph, object 1 is moving with the most acceleration. (Explain if false, or rewrite the statement to make it true. Use the "Show your work" feature.)
On a velocity/time graph, a line with a downward slope (a line going down) means ___________.
Match the distance/time graph with the correct velocity/time graph:
| Draggable item | arrow_right_alt | Corresponding Item |
|---|---|---|
| arrow_right_alt |
|
| arrow_right_alt | |
| arrow_right_alt |
|
| arrow_right_alt |
|
Match the short story (or event) with the correct velocity/time graph:
| Draggable item | arrow_right_alt | Corresponding Item |
|---|---|---|
An object is accelerating at a constant rate. | arrow_right_alt |
|
An object is accelerating, then maintaining a constant velocity, and then slowing down or decelerating. | arrow_right_alt |
|
An object is slowing down, or decelerating, but not at a constant rate. | arrow_right_alt |
|
An object is traveling at a constant velocity. | arrow_right_alt |
|
Which of the following would be a correct unit for acceleration?
An object moving with a constant acceleration is not increasing or decreasing its speed/velocity. (Explain if false, or rewrite the statement to make it true. Use the "Show your work" feature.)
Acceleration can best be described as a change in ________________.
Which scenario does NOT describe an example of acceleration?
The slope on a distance/time graphs tell us the

Looking at the graphs above, which one shows an object increasing its speed/velocity?
Which graph best shows an object decreasing its speed/velocity and then quickly increasing its speed/velocity:
Which scientist came up with Newton's Laws of Motion?
Match the law to the definition:
| Draggable item | arrow_right_alt | Corresponding Item |
|---|---|---|
Second Law of Motion | arrow_right_alt | Objects remain at rest or a constant velocity unless a force is applied |
Third Law of Motion | arrow_right_alt | The force of an object is equal to the product of the mass and acceleration of the object |
First Law of Motion | arrow_right_alt | For every action there's an equal and opposite reaction |
A force is simply a
Which statement best describes inertia?
If the mass of an object stays the same, but the force increases, what happens to the acceleration?
A force of 10 Newtons is applied to an object that weighs 10 kilograms, what is the acceleration of that object?
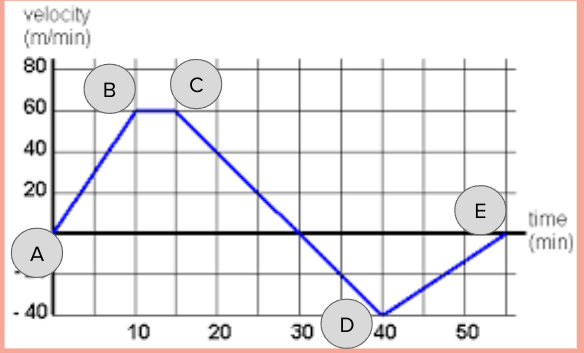
Look at the Velocity vs. Time graph and consider Newton's 1st Law (the law of inertia). When is the net force acting on the car equal to zero?

Based on the vector diagram above, answer the following questions. Be sure to answer all parts of this question for full credit.
- What is the distance traveled?
- What is the displacement? Explain what this means.
- What information would be needed to find the average speed? What information would be needed to find the average velocity?
Look at the data below.
- What is the acceleration of the two objects?
- Which object is accelerating more?
Show how you arrived at your answer. Use the "Show your work" feature to show your calculations.
Subaru Outback - In 40 seconds, the car went from 18 m/s to 36 m/s.
Toyota Tacoma - In 25 seconds, the car went from 22 m/s to 8 m/s.
Acceleration = Change in Velocity / Time
OR
Acceleration = (final velocity - initial velocity) / (final time - initial time)

Look at the graph above and tell a story. Try to be specific to best demonstrate that you understand the graph and its details.
Look at the gif above. Connect the event to Newton's Three Laws of Motion. Be detailed and demonstrate that you understand Newton's Three Laws.

Given the force arrow diagram above, what is the net force? Are the forces here unbalanced or balanced? Will the velocity of the box change? Why?
Be sure to answer all parts of this question for full credit.


