Context 24a - M&M Data Collection
star
star
star
star
star
Posljednje ažuriranje about 2 years ago
13
Napomena autora:
MMR Resources
MMR Resources

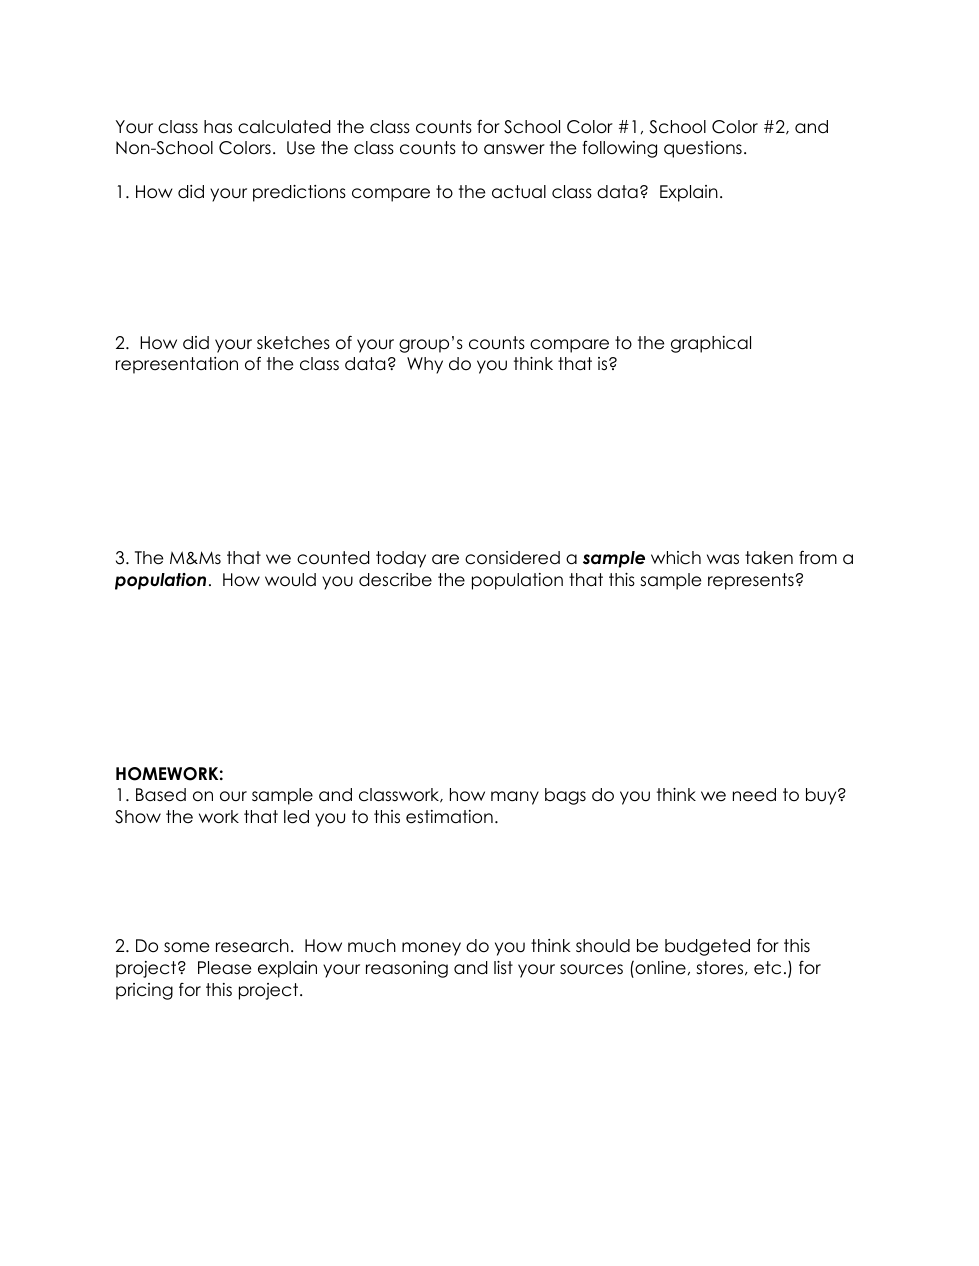
How did your predictions on #4-6 compare to the actual class data on the spreadsheet? Explain.
How did the pie graph of your group’s data on #7 compare to the pie graph of the class data in the spreadsheet? Why do you think that is?
The M&Ms that we counted today are considered a sample which was taken from a population. How would you describe the population that this sample represents?
How many Red M&Ms did your sample contain?
How many Yellow M&Ms did your sample contain?
How many other M&Ms did your sample contain?
Add your answers beside your name on this spreadsheet as well.
Based on the number of Red M&Ms you have, how many red M&Ms do you predict a class of 25 students has?
Based on the number of yellow M&Ms you have, how many yellow M&Ms do you predict a class of 25 students has?
Based on the number of other M&Ms you, how many other M&Ms do you predict a class of 25 students has?
Draw a graphical display of this data using a pie graph.
Draw a second graphical display of this data using a different method than you did on #7 such as a bar or line graph.
Based on our sample and classwork, how many bags (cups) do you think we need to buy so that 100 students could each get a bag with 15 M&Ms in the school colors of yellow and red?
Do some research. How much money do you think should be budgeted for this project?