Context 24b - M&M Sampling Distributions
star
star
star
star
star
Posljednje ažuriranje about 2 years ago
13
Napomena autora:
MMR Resources
1
1
MMR Resources
Suppose now that we want to answer the question, “What proportion of ALL M&M candies manufactured in the U.S. are our school color (red and yellow)?”
How might you go about answering this question?
Which do you think would give us a better idea of the proportion of ALL M&Ms that are our school color: A sample of 5 M&Ms or a sample of 100 M&Ms? Why do you think that?
If two different students both chose samples of size 100, would the two samples necessarily have the same proportion of candies that are our school color? Explain.
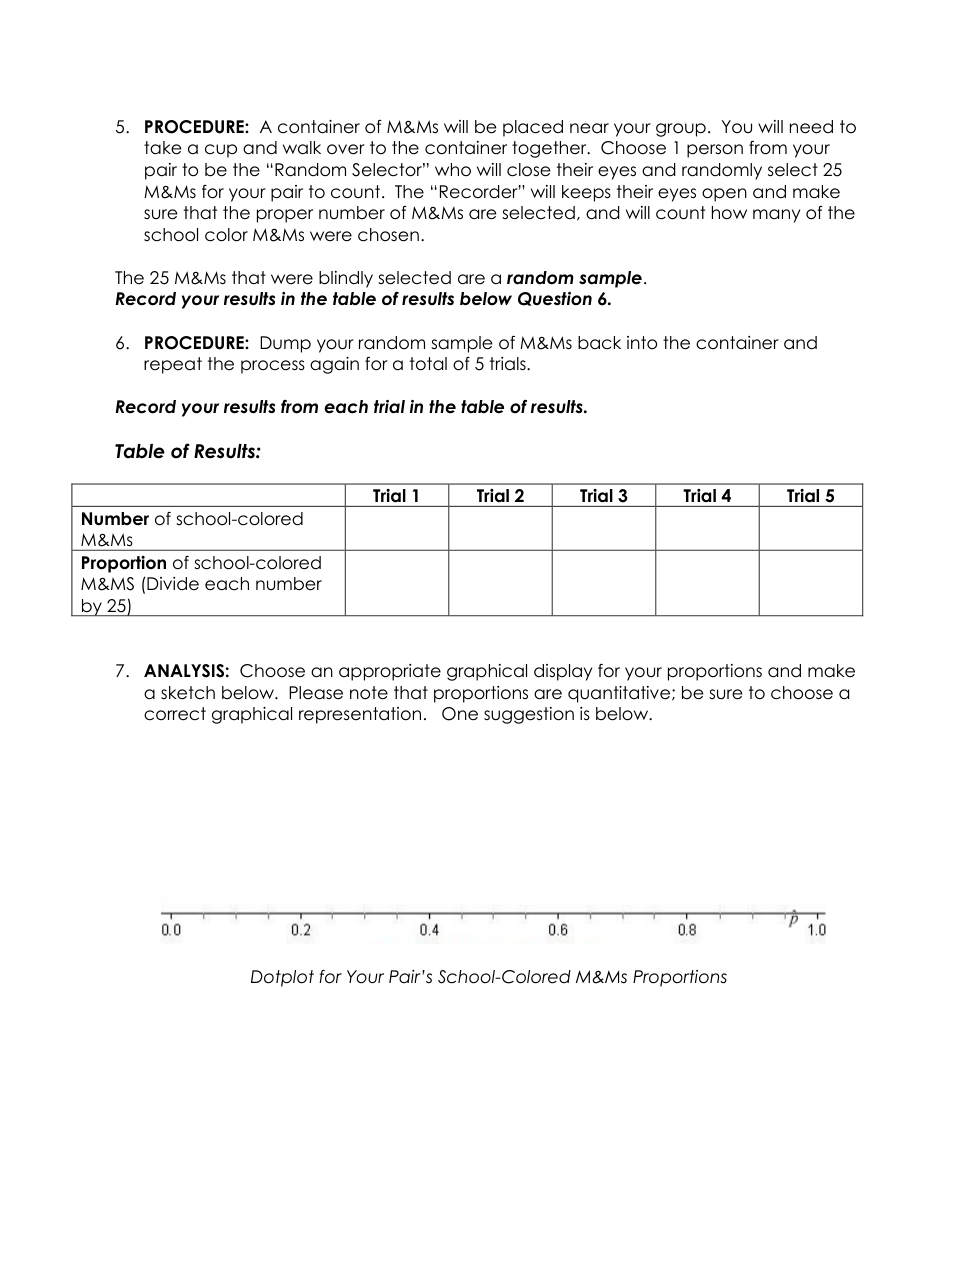
Choose 1 person from your pair to be the “Random Selector” who will close their eyes and randomly select 25 M&Ms for your pair to count. The “Recorder” will keeps their eyes open and make sure that the proper number of M&Ms are selected, and will count how many of the school color (red and yellow) M&Ms were chosen. Repeat this 5 times.
Create a dotplot of the proportions below.
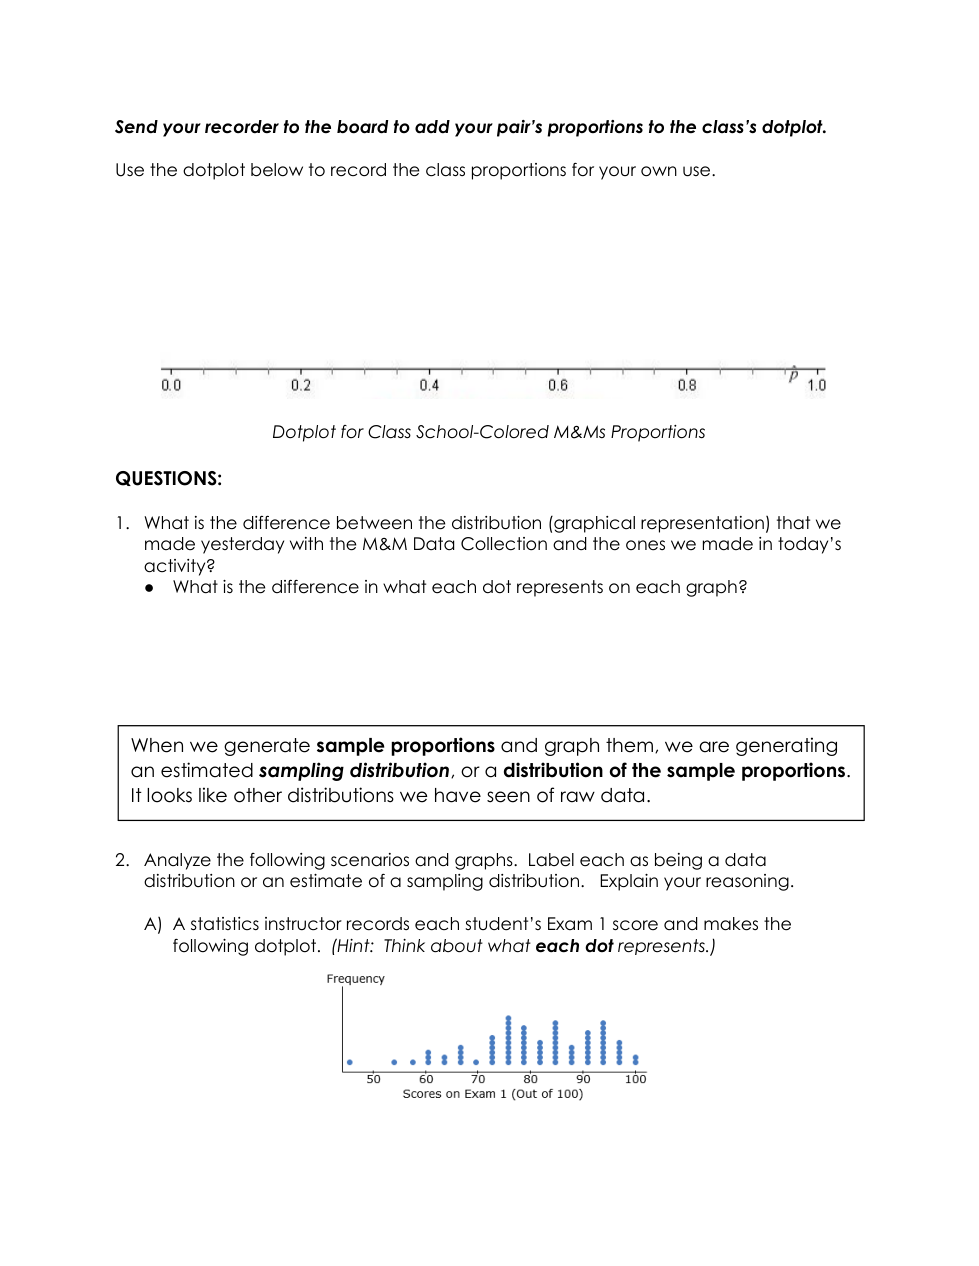
What is the difference between the distribution (graphical representation) that we made yesterday with the M&M Data Collection and the ones we made in today’s activity?
Analyze the following scenarios and graphs. Label each as being a data distribution or an estimate of a sampling distribution.
A statistics instructor records each student’s Exam 1 score and makes the following dotplot. (Hint: Think about what each dot represents.)
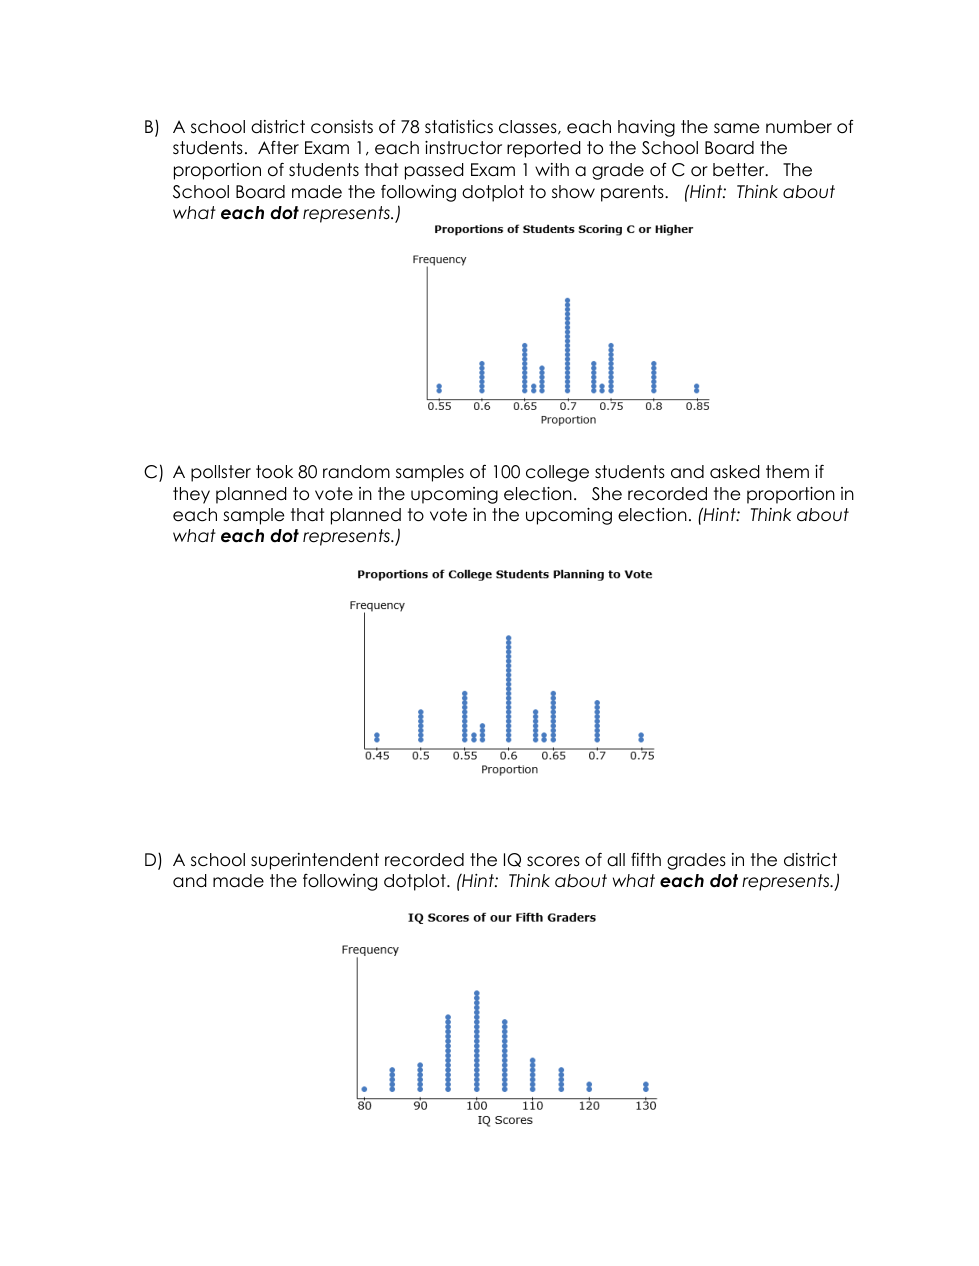
A school district consists of 78 statistics classes, each having the same number of students. After Exam 1, each instructor reported to the School Board the proportion of students that passed Exam 1 with a grade of C or better. The School Board made the following dotplot to show parents.
A pollster took 80 random samples of 100 college students and asked them if they planned to vote in the upcoming election. She recorded the proportion in each sample that planned to vote in the upcoming election.
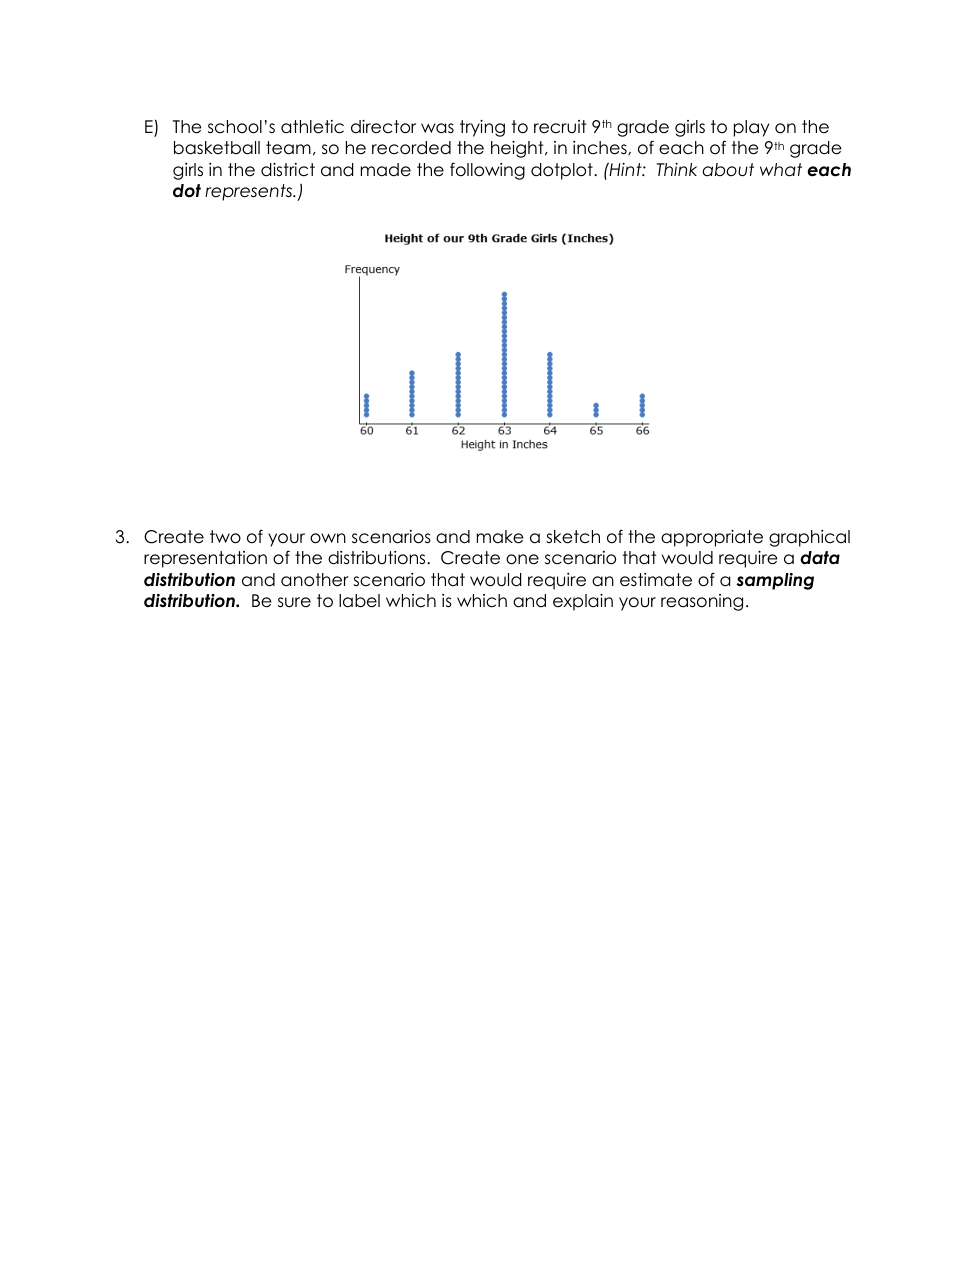
The school’s athletic director was trying to recruit 9th grade girls to play on the basketball team, so he recorded the height, in inches, of each of the 9th grade girls in the district and made the following dotplot.
What does the word “random” mean mathematically? You may want to Google this one.
Pretend that 10 students each took samples of 25 M&Ms . Write down the number of your school-colored (red and yellow) M&Ms that you might expect for these 10 samples:
A school superintendent recorded the IQ scores of all fifth grades in the district and made the following dotplot.