Context 24c - M&M Simulations
star
star
star
star
star
Last updated over 1 year ago
24 questions
Note from the author:
MMR Resources

1
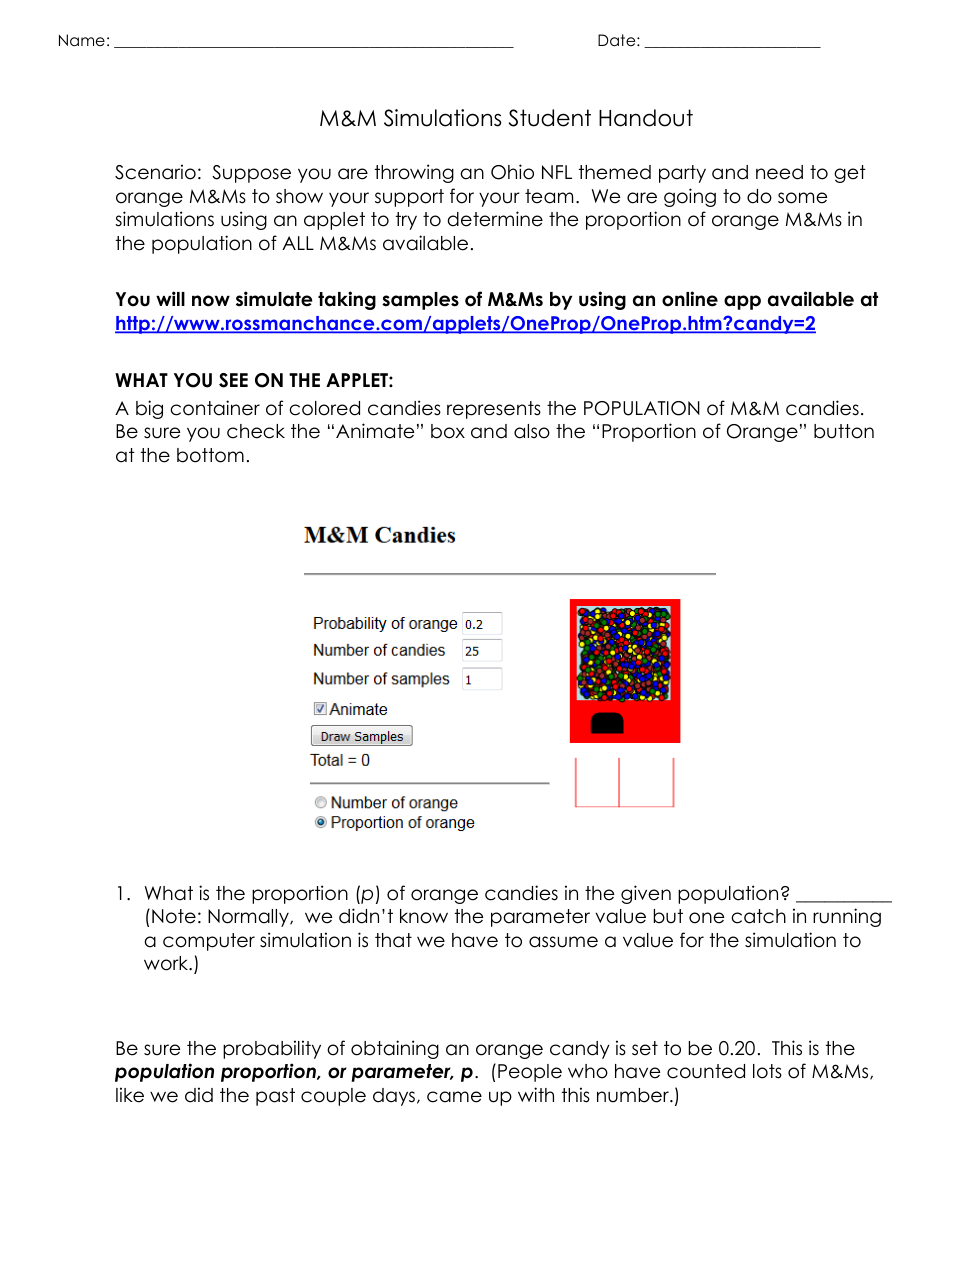
What is the proportion (p) of orange candies in the given population? In other words, what percentage of all m&ms are orange? (you can google this)

1
Click on the “Draw Samples” button in the applet. One sample of 25 candies will be taken and the proportion of orange candies for this sample is plotted on the graph. What is the sample proportion (𝑝̂) of orange candies?
Click on the “Draw Samples” button in the applet.
One sample of 25 candies will be taken and the proportion of orange candies for this sample is plotted on the graph. What is the sample proportion (𝑝̂) of orange candies?
1
Repeat this again. (Draw a second sample.) What is the sample proportion (𝑝̂) of orange candies in this sample?
Repeat this again. (Draw a second sample.)
What is the sample proportion (𝑝̂) of orange candies in this sample?
1
Do you get the same or different values for each sample proportion (𝑝̂) on #2 and 3? Why do you think that is?
Do you get the same or different values for each sample proportion (𝑝̂) on #2 and 3?
Why do you think that is?
1
How close is each sample statistic (𝑝̂) (answers on #2 and 3) to the population parameter (p) we gave on #1?
1
Describe the shape of the data.
1
Around where is the center of the data?
1
How far is the data spread out?

1
How does this distribution compare to the one our class constructed on the board from our previous lesson in terms of shape? Center? Spread?
1
Use the sampling distribution to answer the following. If we ran the simulation and obtained a sample of 0.4 (40% of our candies were orange), would that result be unusual based on the distribution? Interpret what that means for our distribution.
1
List the mean (you'll find it by the graph on the simulation website)
1
List the standard deviation (you'll find it by the graph on the simulation website)

1
What do you think will happen to the distribution of sample proportions if we change the sample size to 50? Explain.
1
What do you think will happen if we change the sample size to 500? Explain
1
If we run 50 samples with 25 candies, what is the mean?
1
If we run 50 samples with 25 candies, what is the Standard Deviation (SD)?
1
If we run 50 samples with 50 candies, what is the mean?
1
If we run 50 samples with 50 candies, what is the Standard Deviation?
1
If we run 50 samples with 500 candies, what is the Mean?
1
If we run 50 samples with 500 candies, what is the Standard Deviation?
1
If we run 50 samples with 5 candies, what is the Mean?
1
If we run 50 samples with 5 candies, what is the Standard Deviation?
1
As the sample size increases, what happens to the standard deviation (spread)?
1
As the sample size increases what effect does it have on the distribution of sample statistics in terms of shape, center and spread.