
Obavezno
1
What are the solutions to the system?
What are the solutions to the system?
A1.REI.B.4
This is Session 1 of the Missouri End of Course Algebra I exam that was released by DESE for teacher and student review.
All standards are labeled, point values have been kept the same as much as possible, and only one question (#29) requires teachers to physically grade/enter a score.
Directions to the Student
Today you will be taking Session I of the Missouri Algebra I Test. This is a test of how well you understand the course level expectations for Algebra I.
There are several important things to remember:
1 Read each question carefully and think about the answer. Then choose the answer that you think is best.
2 Make sure you clearly mark the correct choice in your test book.
3 If you do not know the answer to a question, skip it and go on. You may return to it later if you have time.
4 If you finish the test early, you may check over your work.
What are the solutions to the system?
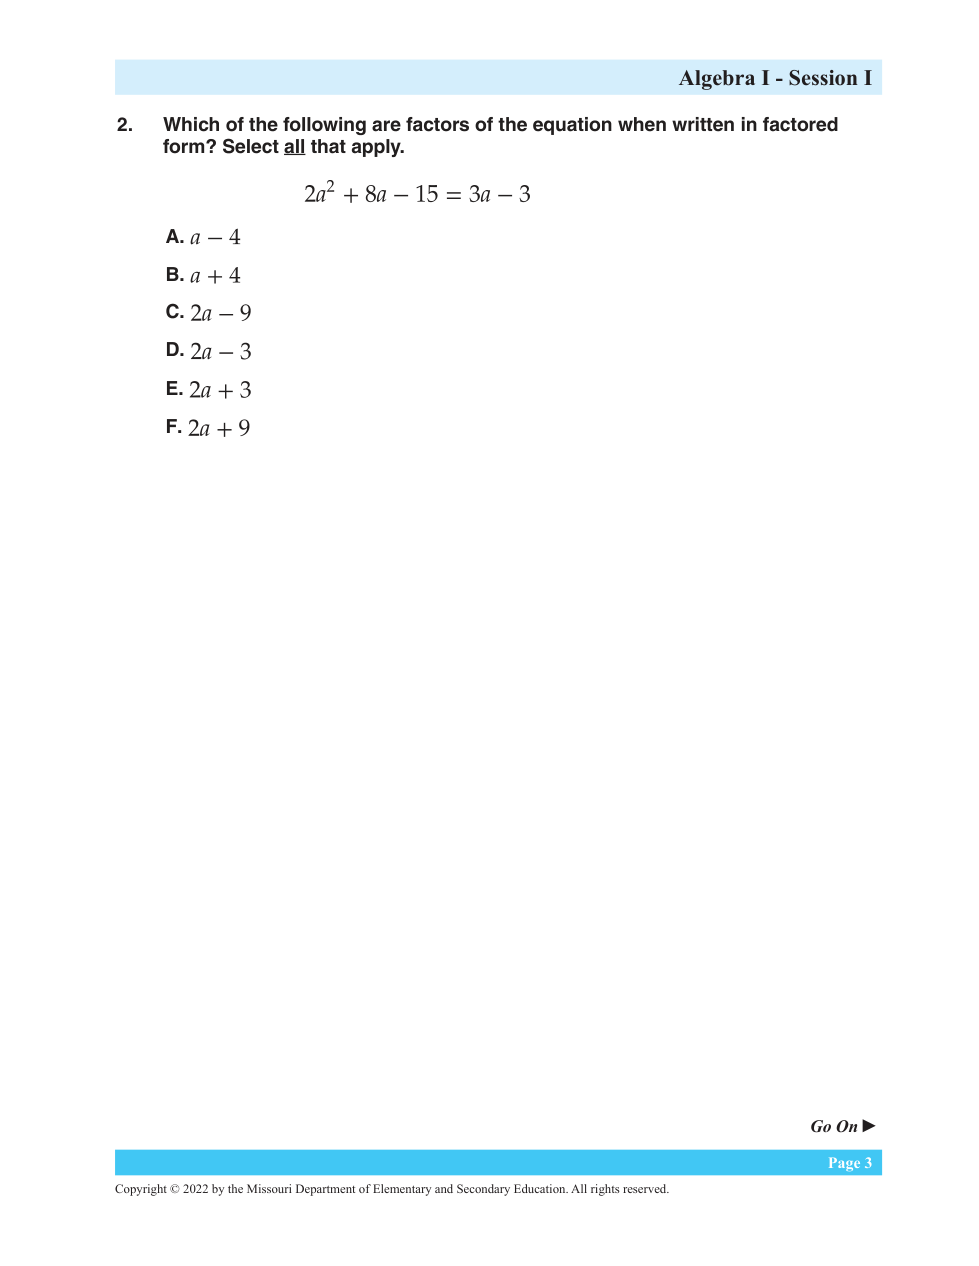
Which of the following are factors of the equation when written in factored form? Select all that apply.
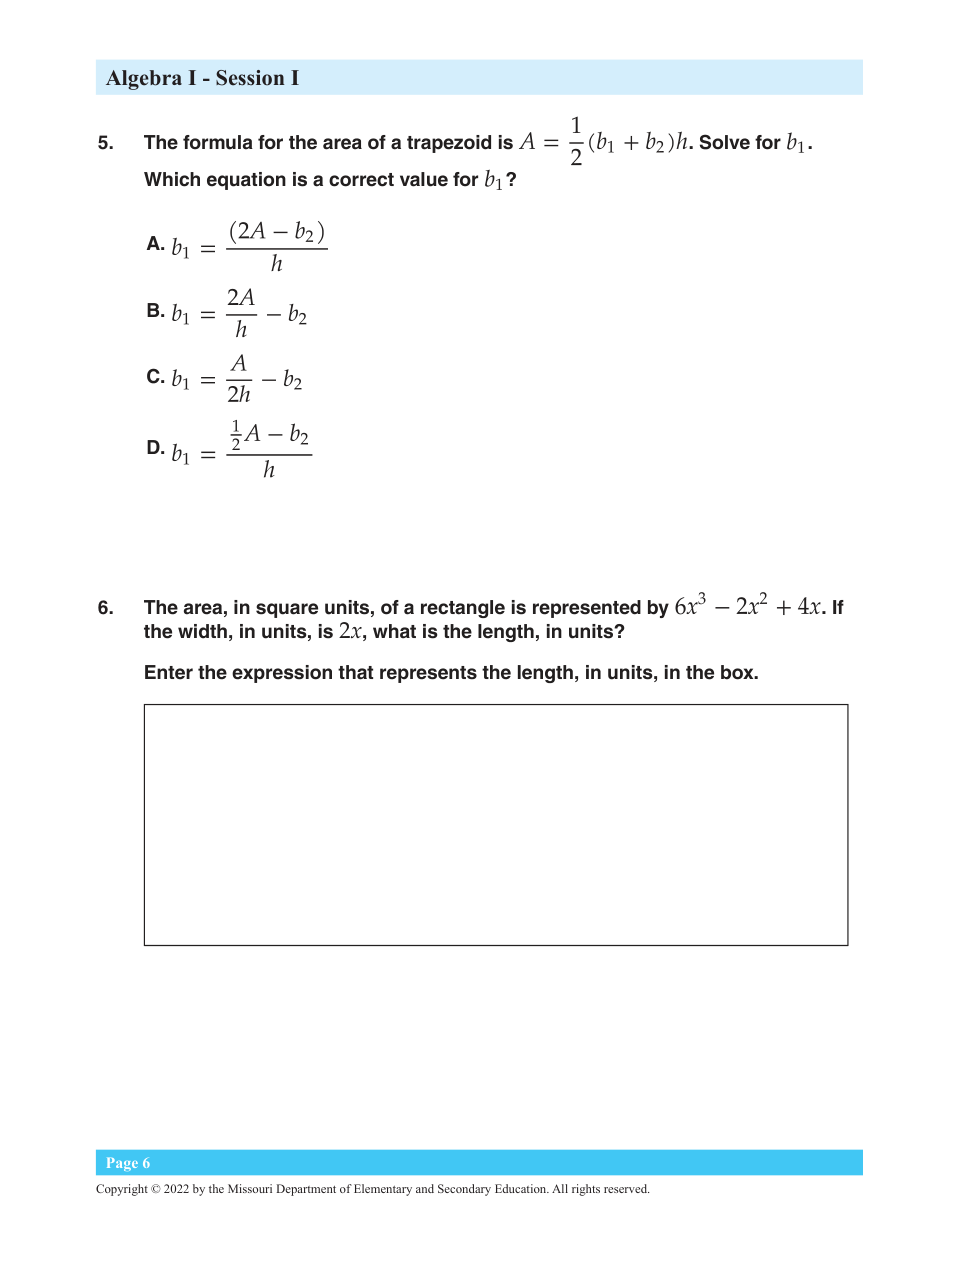
Which equation is a correct value for
?
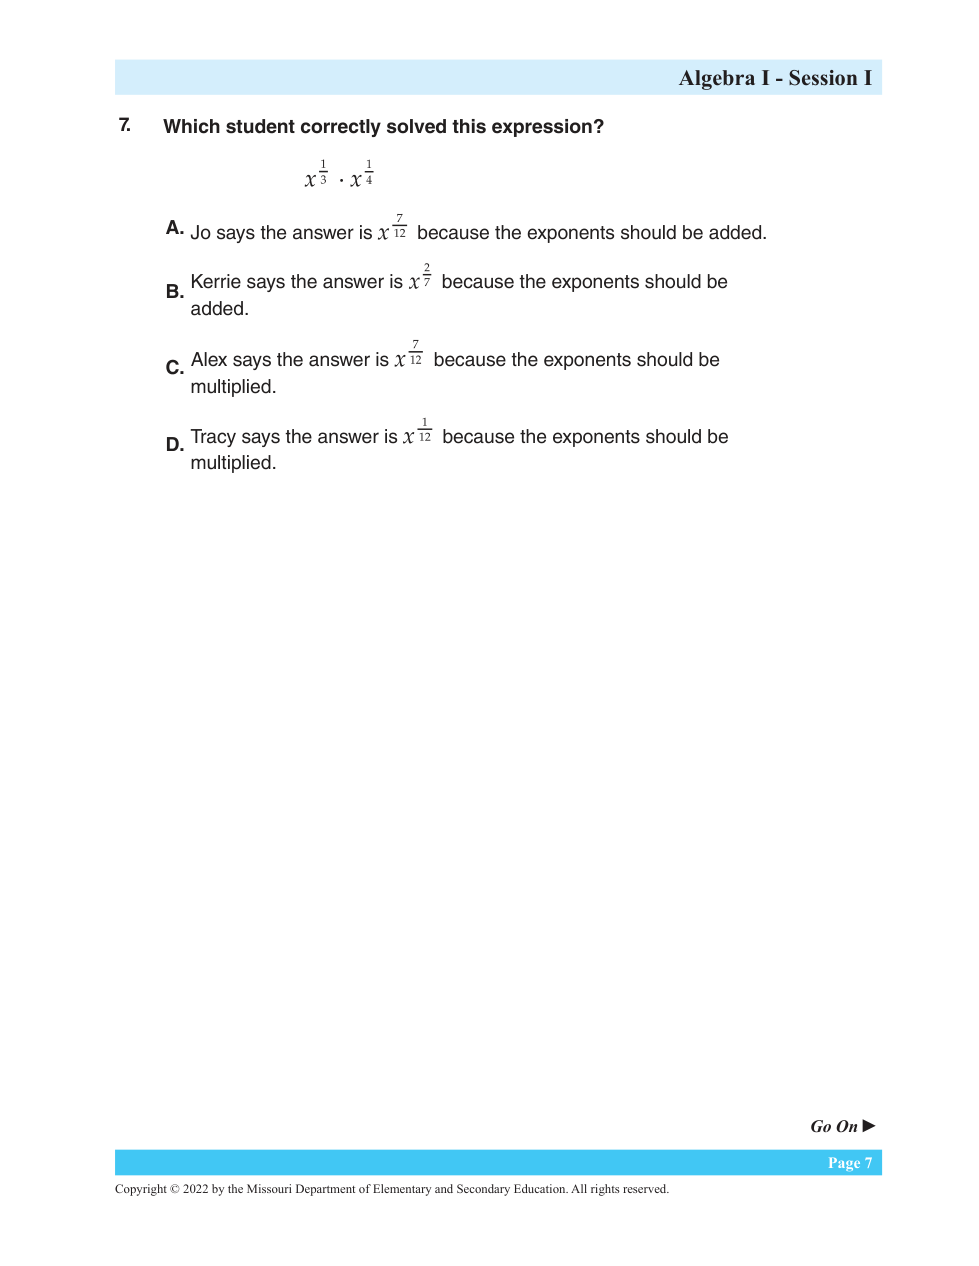
Which student correctly solved this expression?
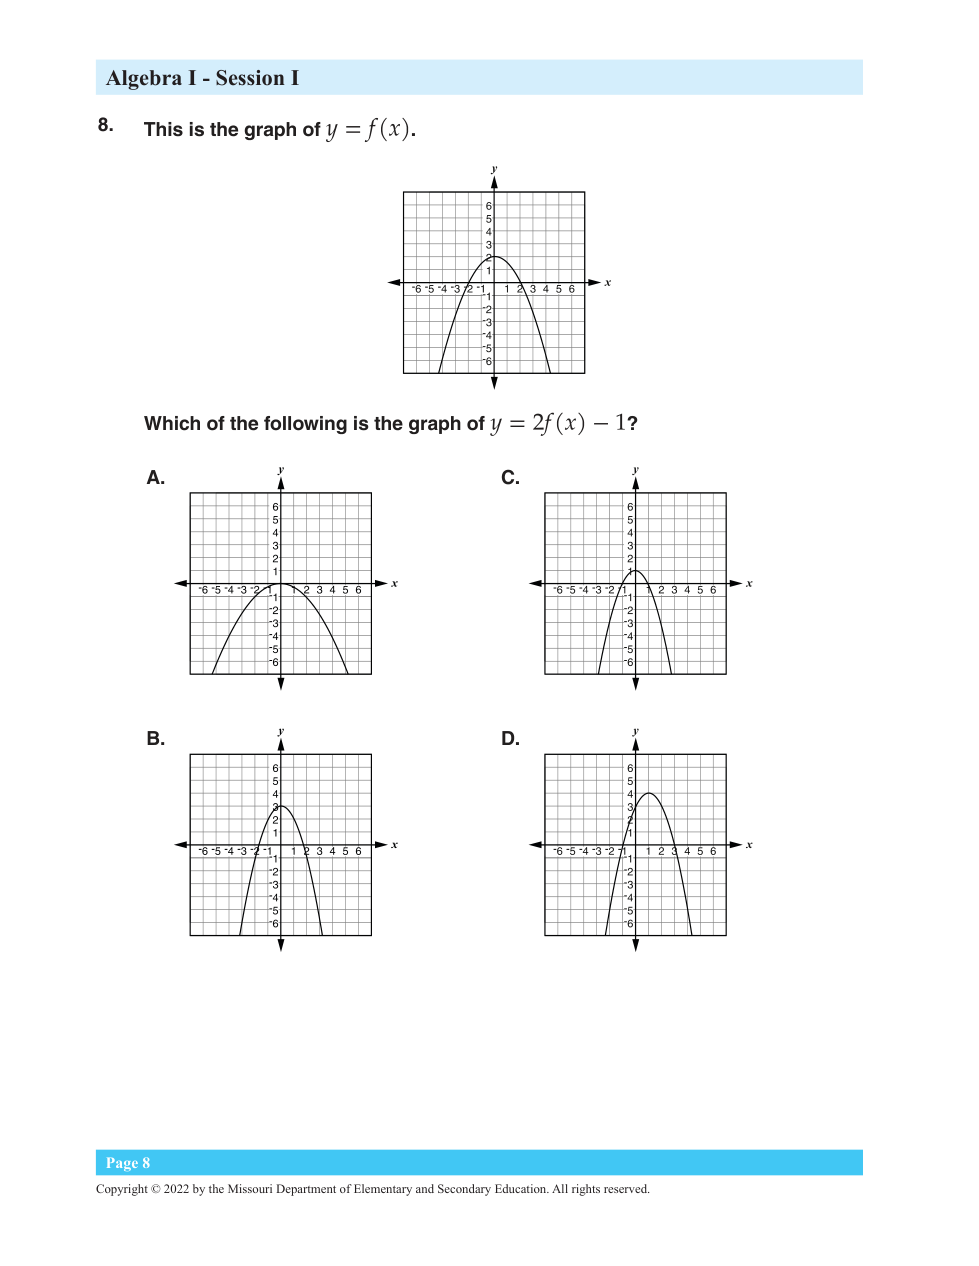
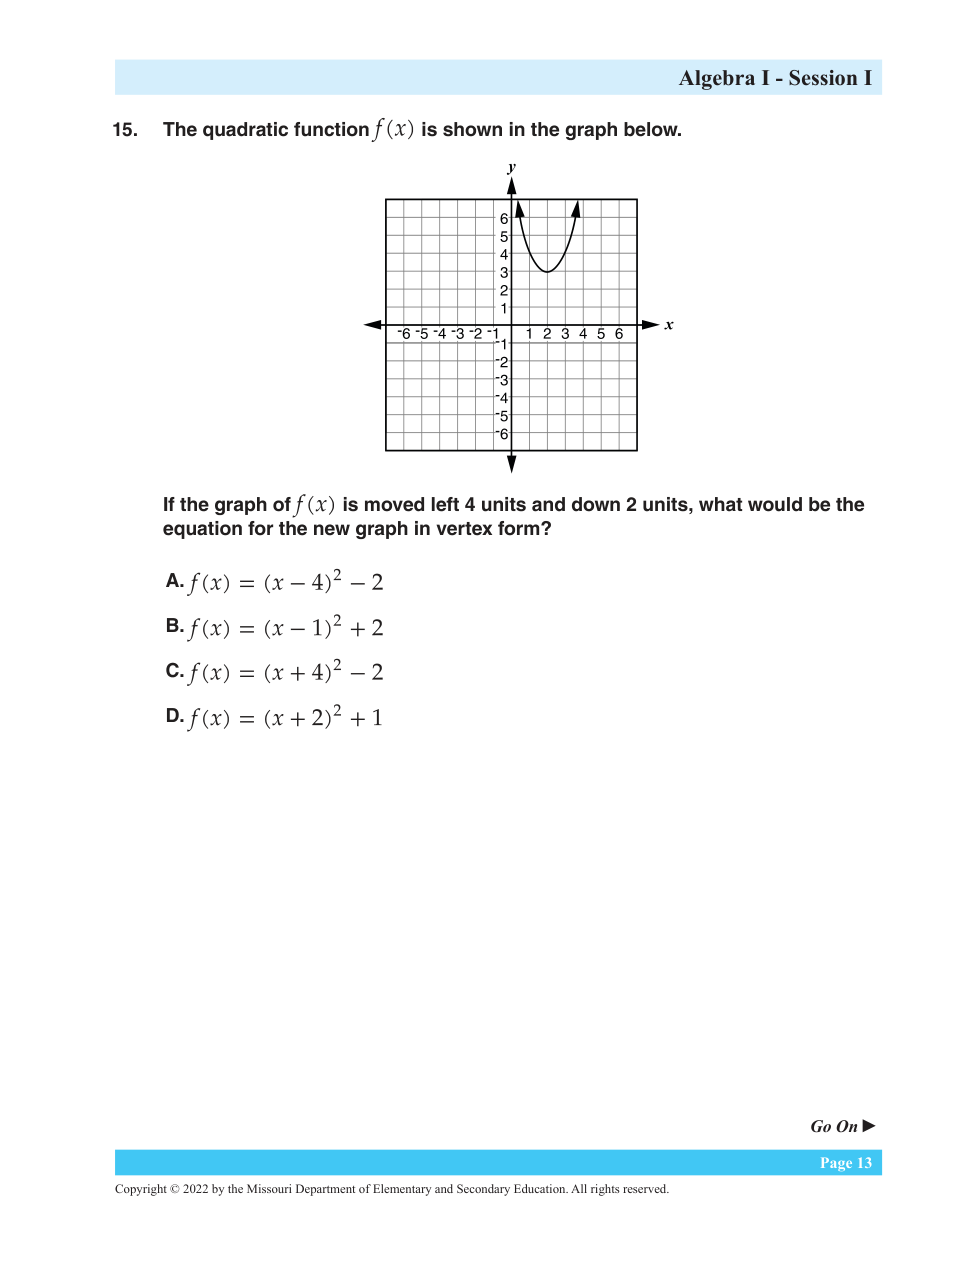
Which of the following is the graph of
?
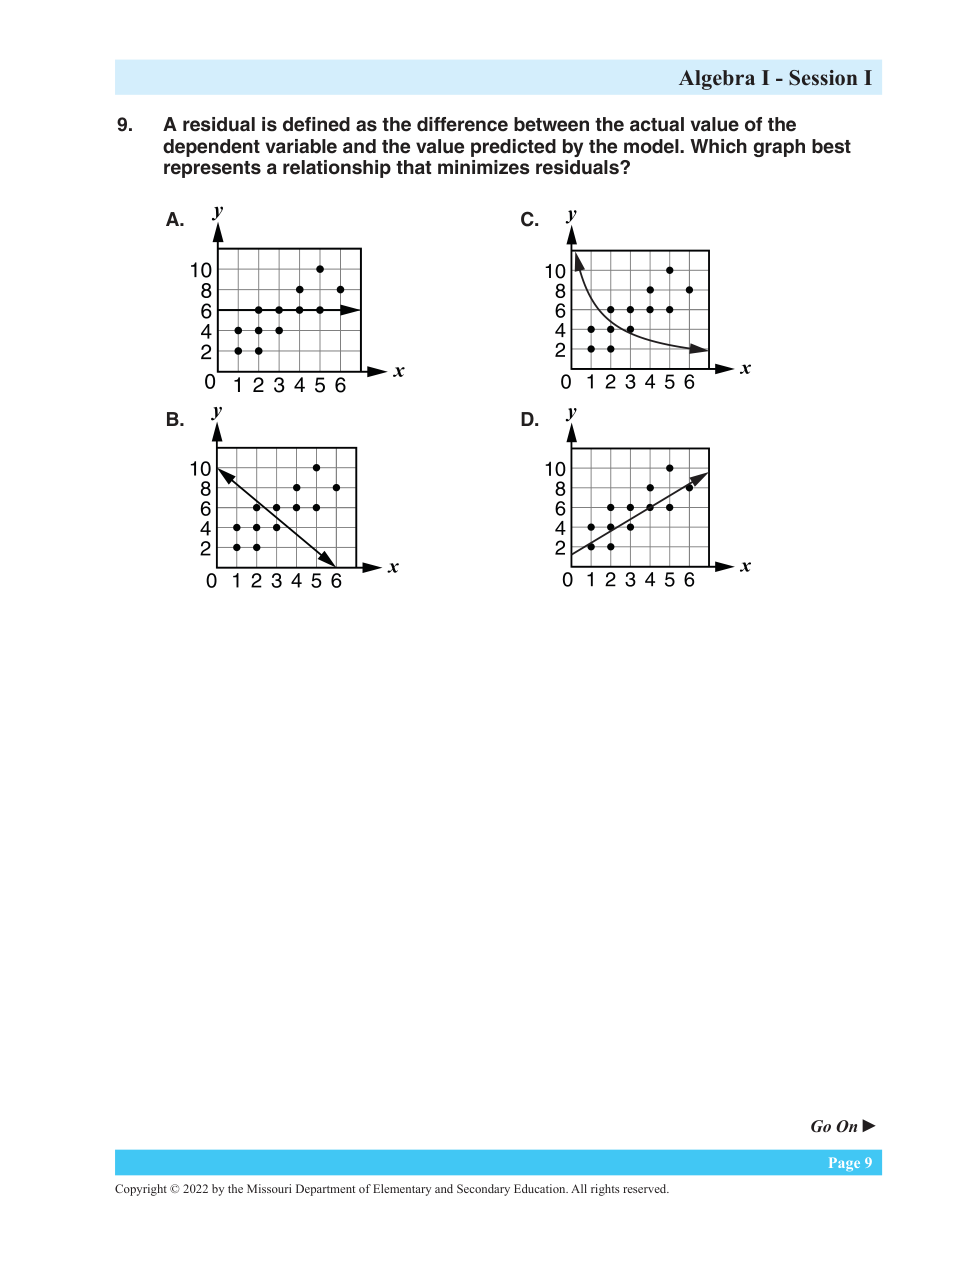
A residual is defined as the difference between the actual value of the dependent variable and the value predicted by the model. Which graph best represents a relationship that minimizes residuals?
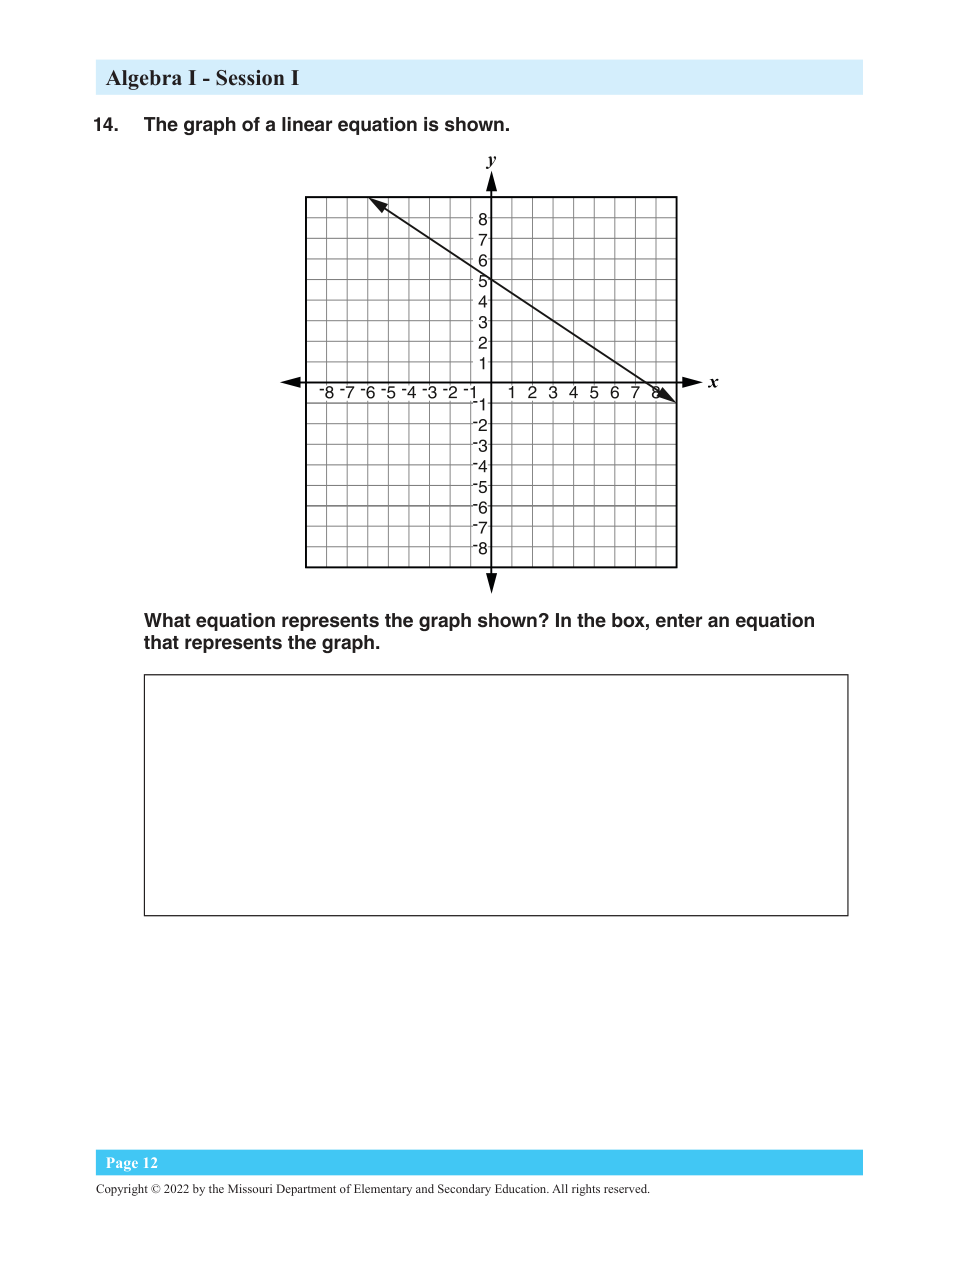
What equation represents the graph shown? In the space provided below, enter an equation that represents the graph.
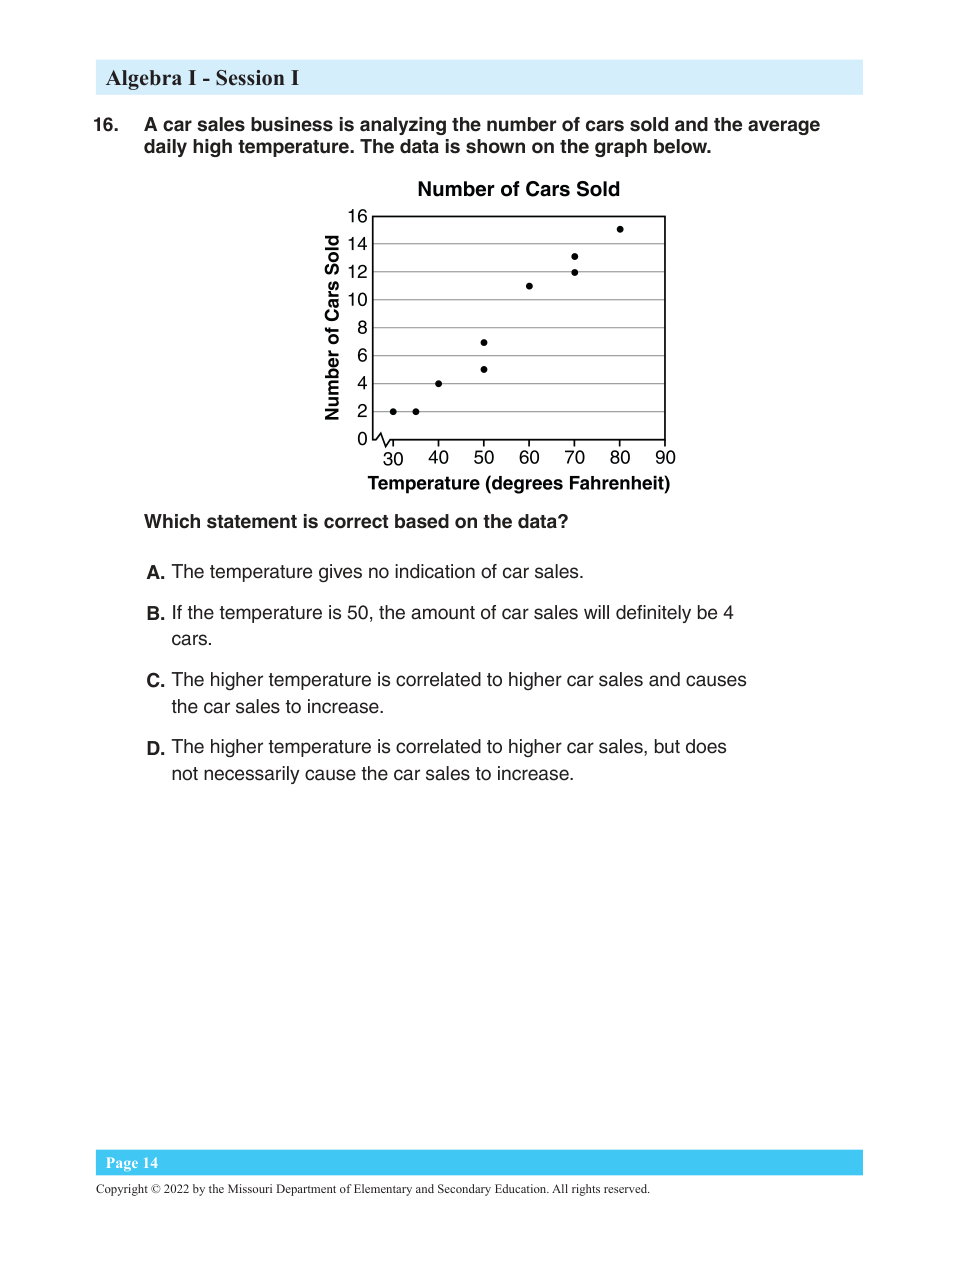
Which statement is correct based on the data?
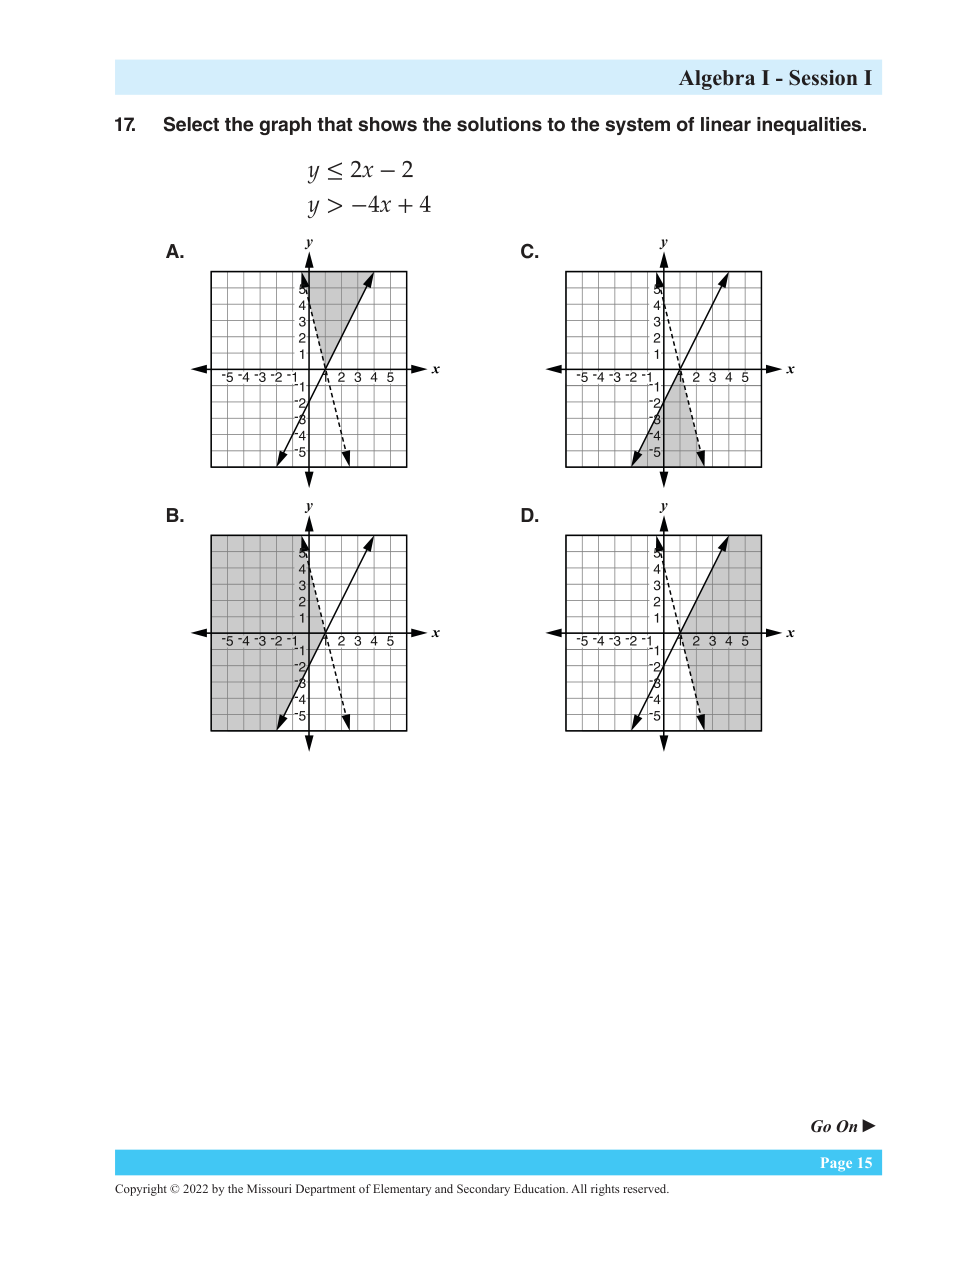
Select the graph that shows the solutions to the system of linear inequalities.
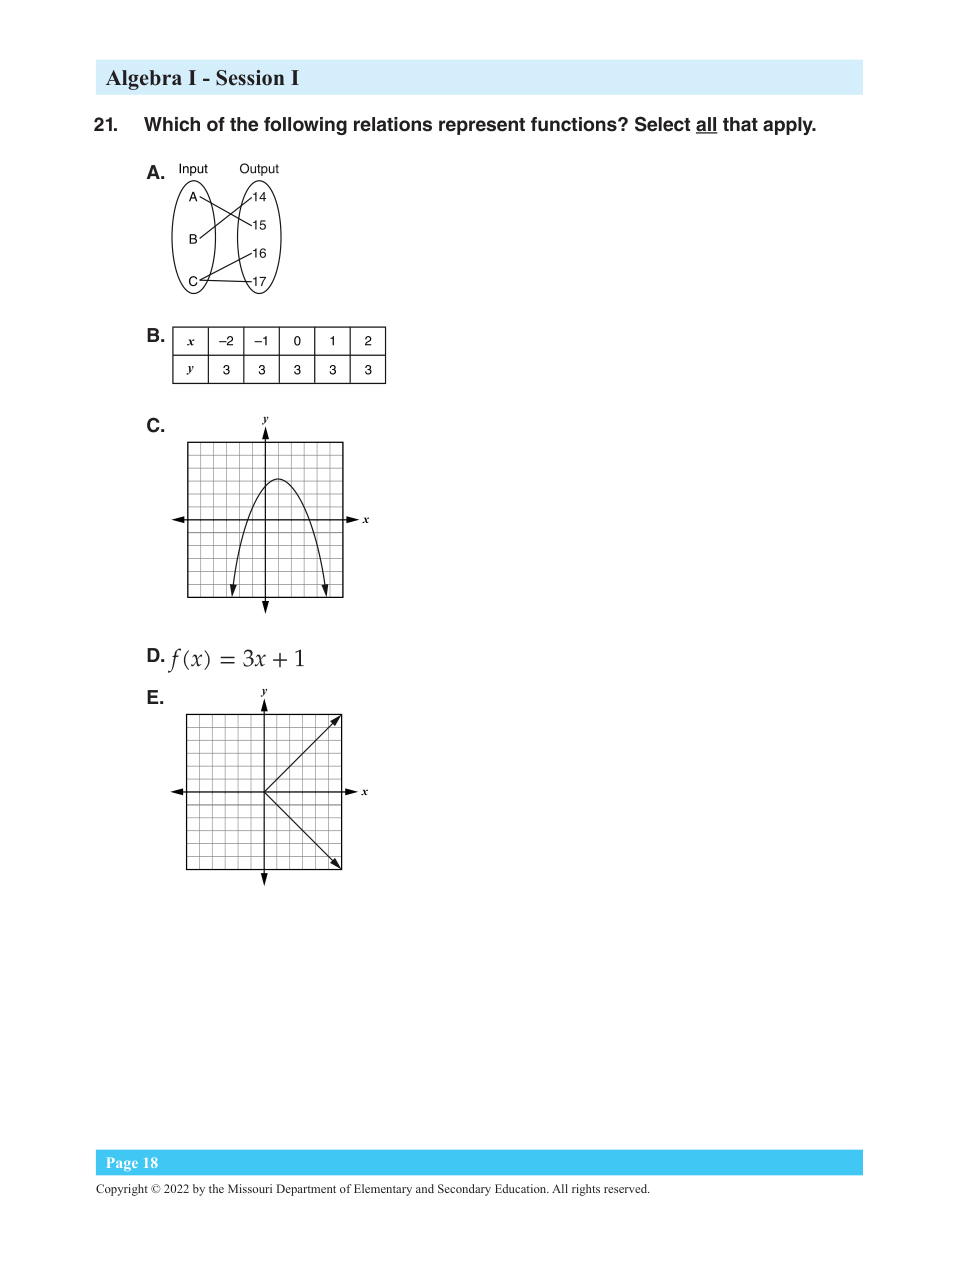
Which of the following relations represent functions? Select all that apply.
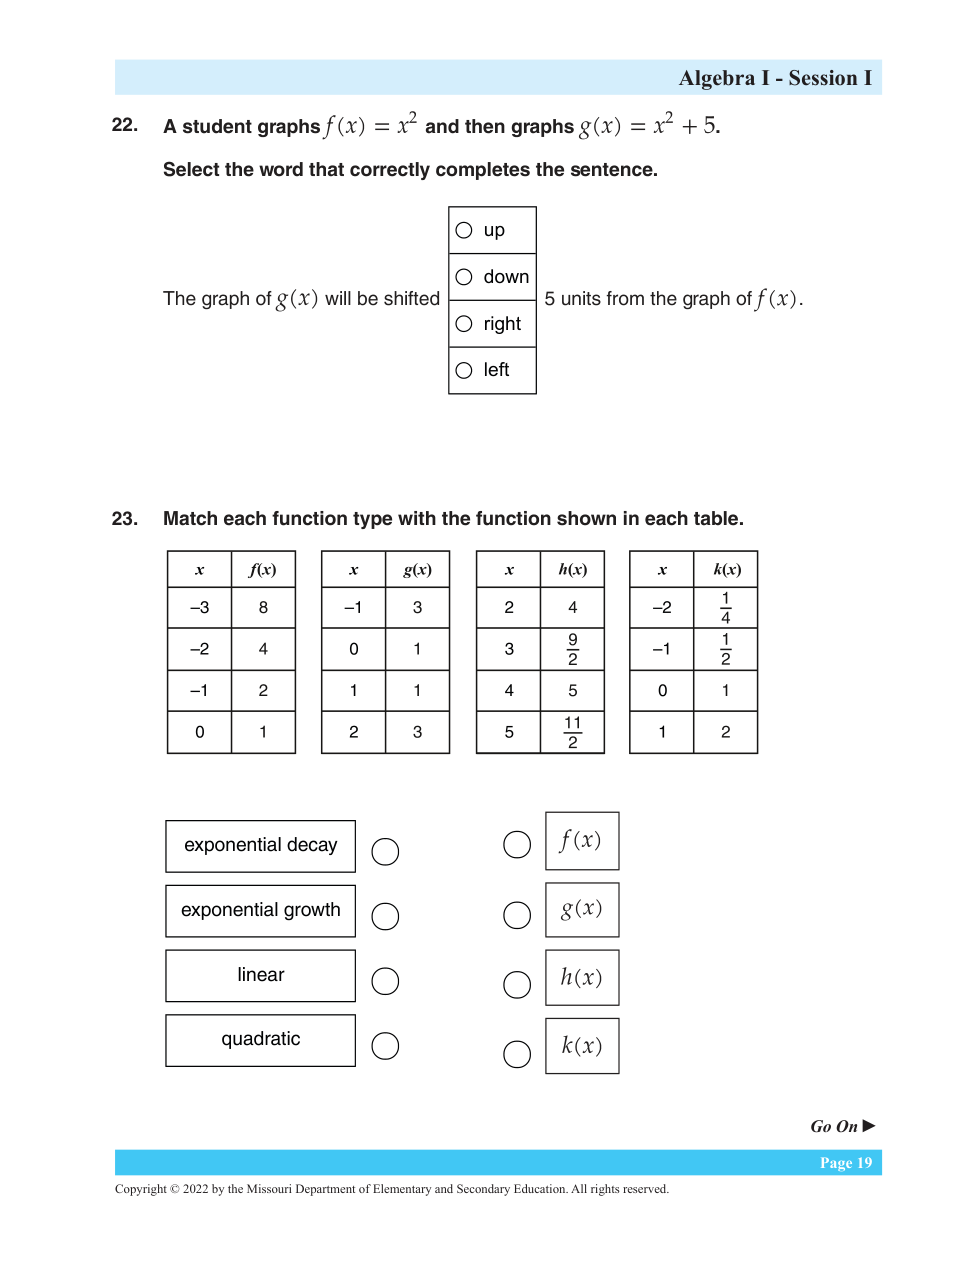
The graph of g (x) will be shifted 5 units from the graph of f(x).
Match each function type with the function shown in each table.
| Stavka koja se može prevući | arrow_right_alt | Odgovarajuća stavka |
|---|---|---|
exponential growth | arrow_right_alt | |
quadratic | arrow_right_alt | |
exponential decay | arrow_right_alt | |
linear | arrow_right_alt |
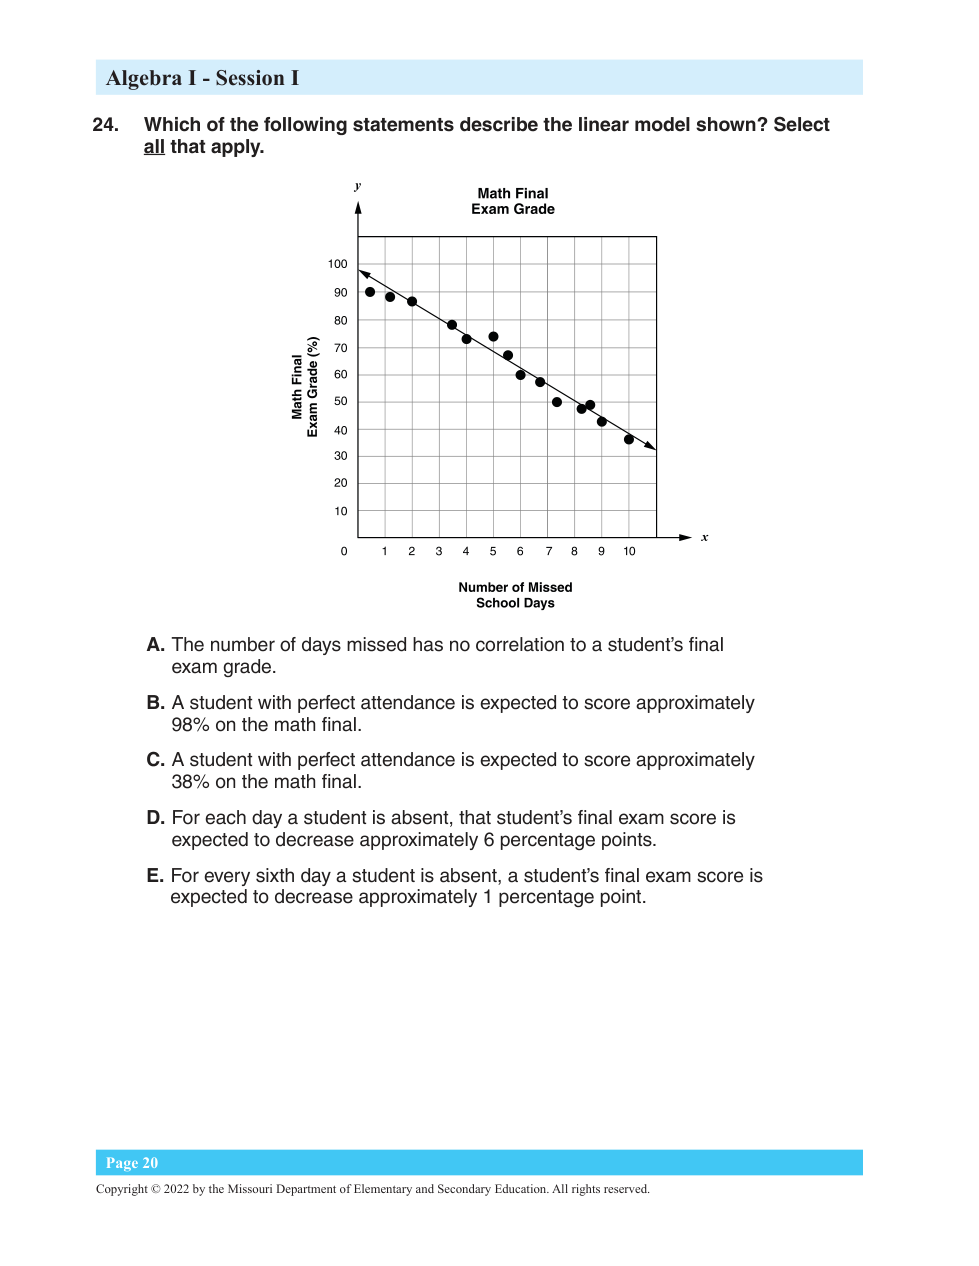
Which of the following statements describe the linear model shown? Select all that apply.
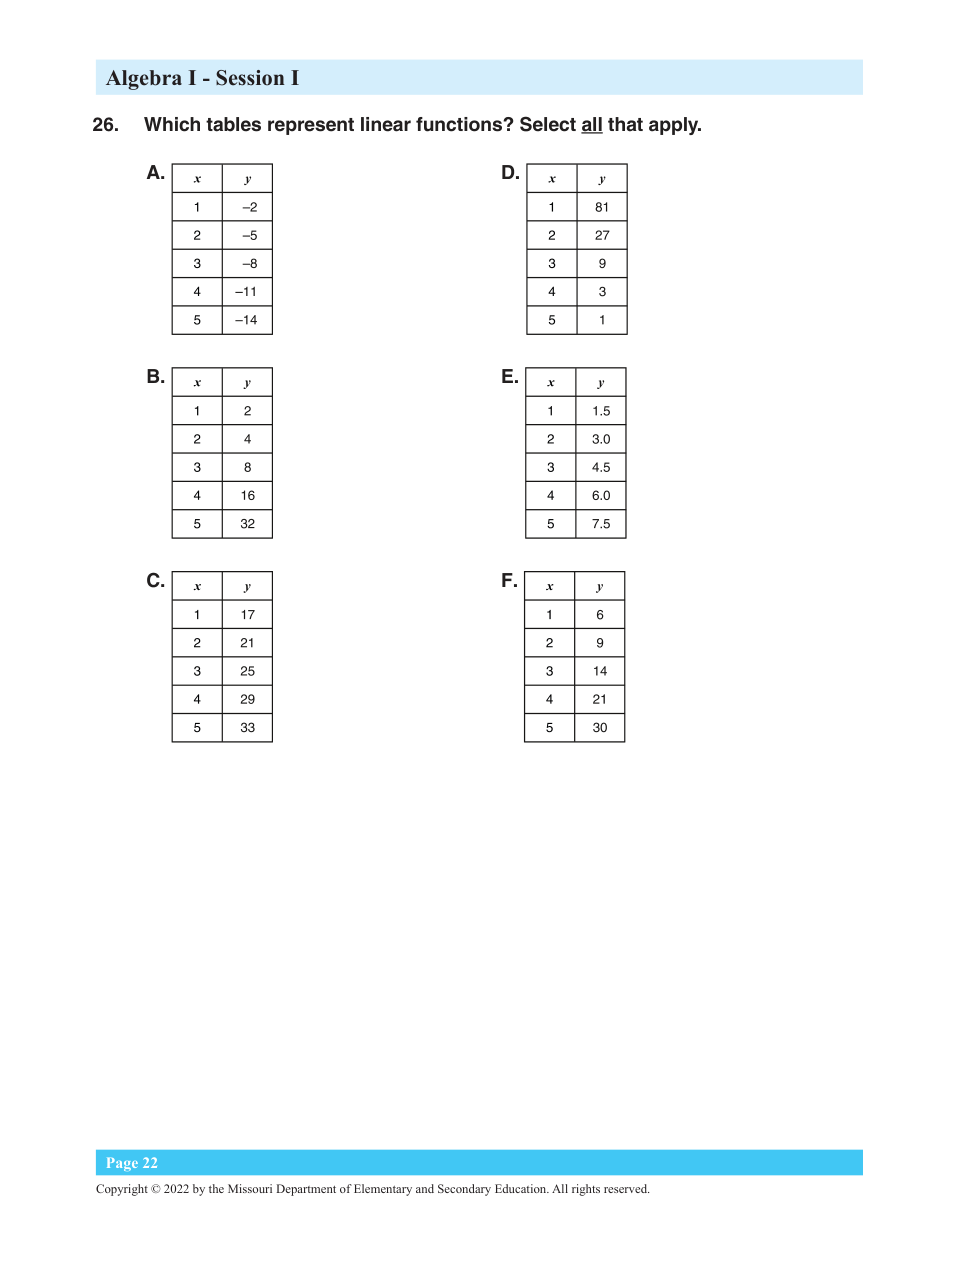
Which tables represent linear functions? Select all that apply.
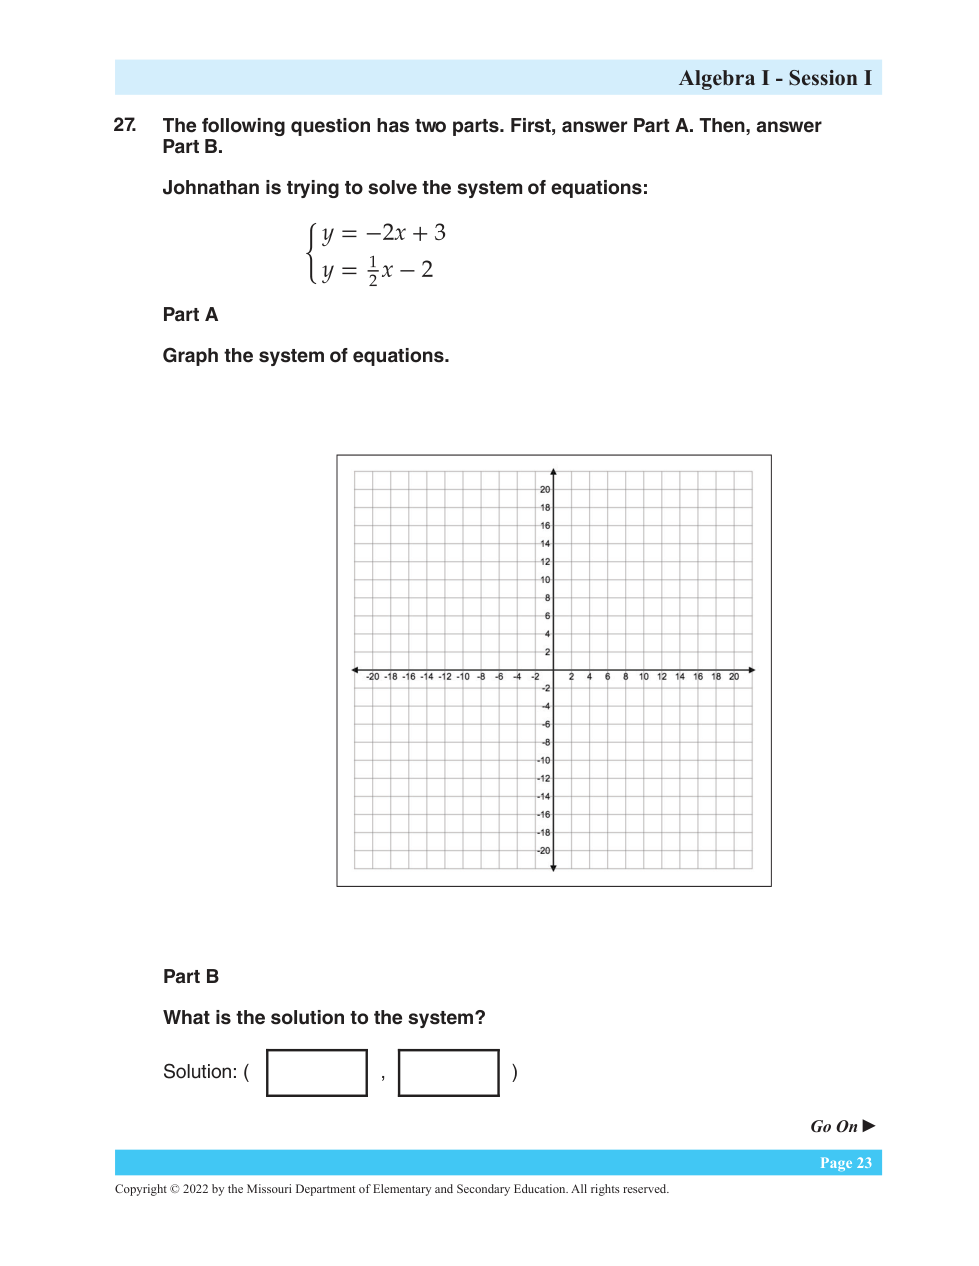
Part A: Graph the system of equations.
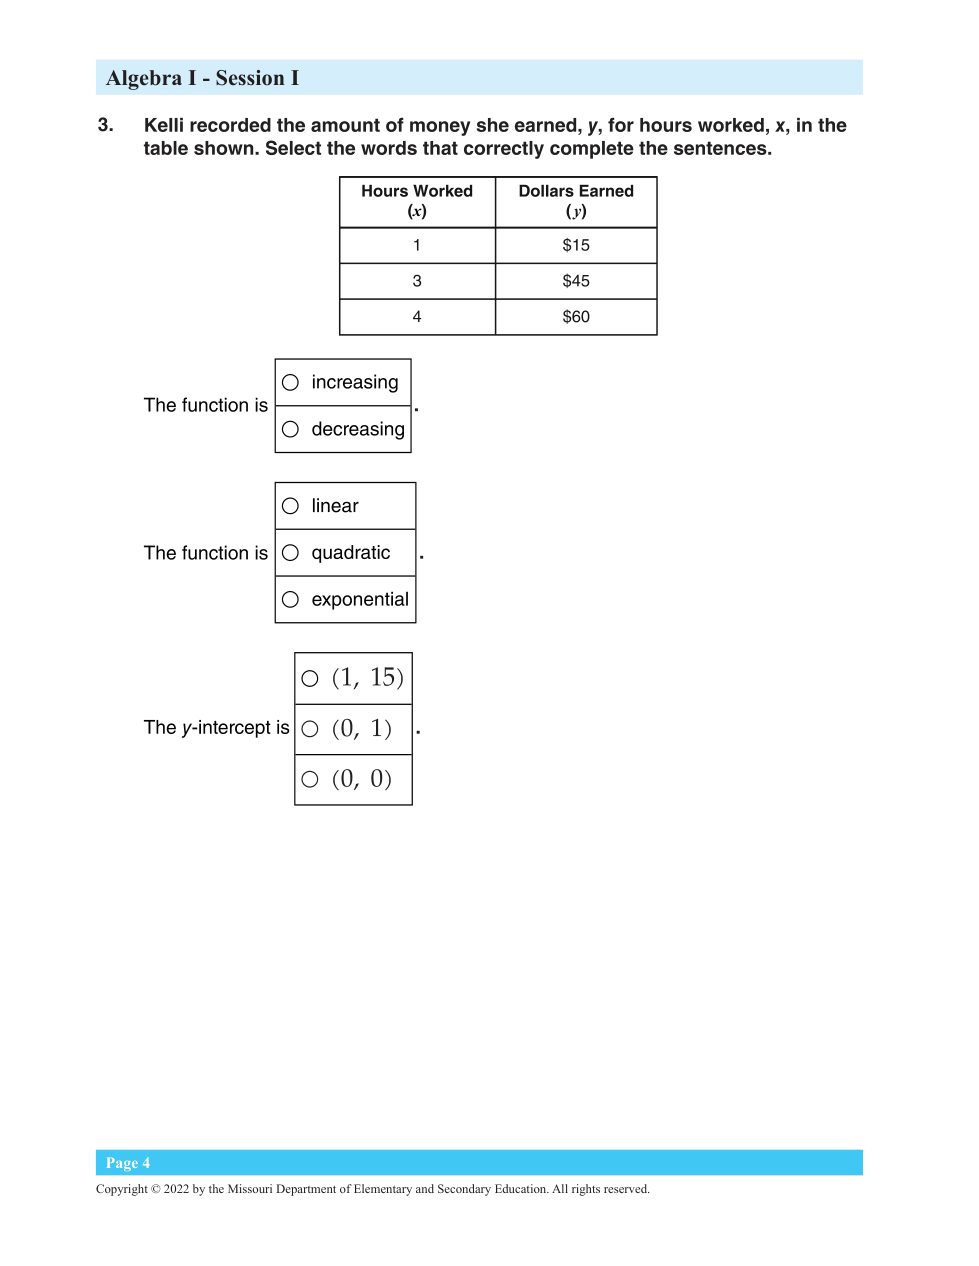
The function is
The function is
The y-intercept is
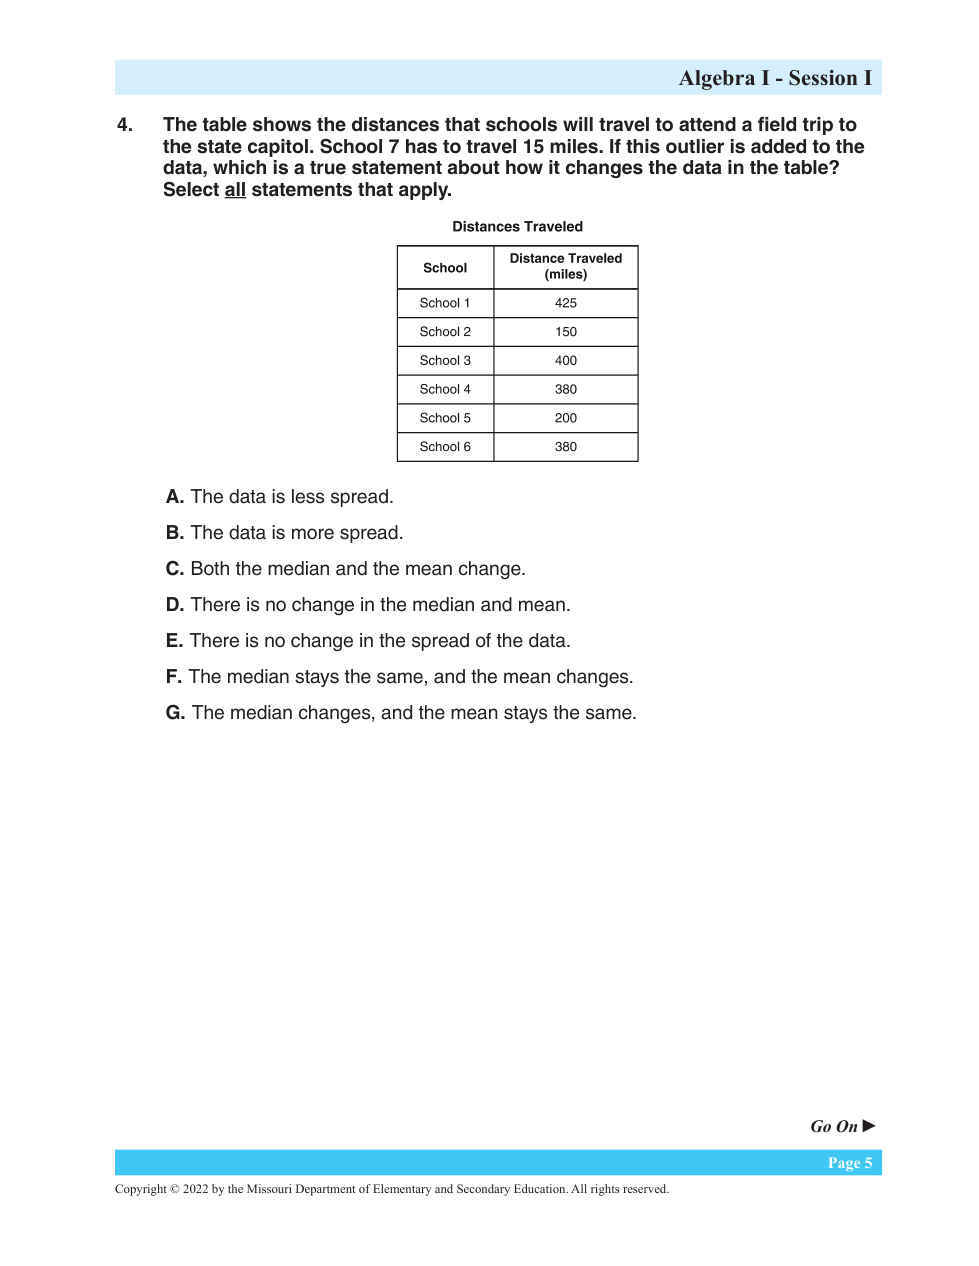
The table shows the distances that schools will travel to attend a field trip to the state capitol. School 7 has to travel 15 miles. If this outlier is added to the data, which is a true statement about how it changes the data in the table? Select all statements that apply
Enter the expression that represents the length, in units, in the box.
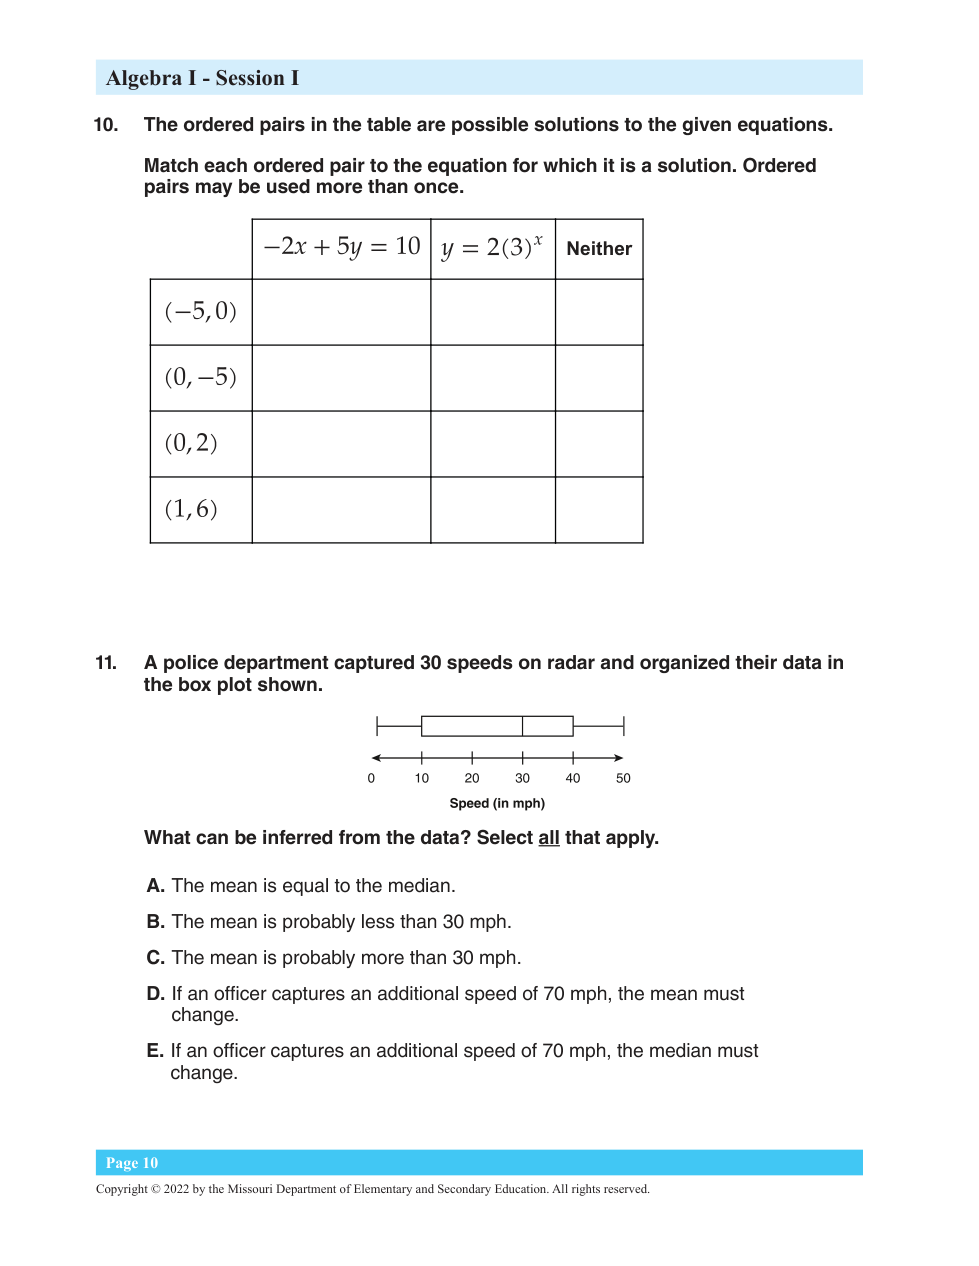
Neither | |||
|---|---|---|---|
(-5, 0) | |||
(0, -5) | |||
(0, 2) | |||
What can be inferred from the data? Select all that apply.
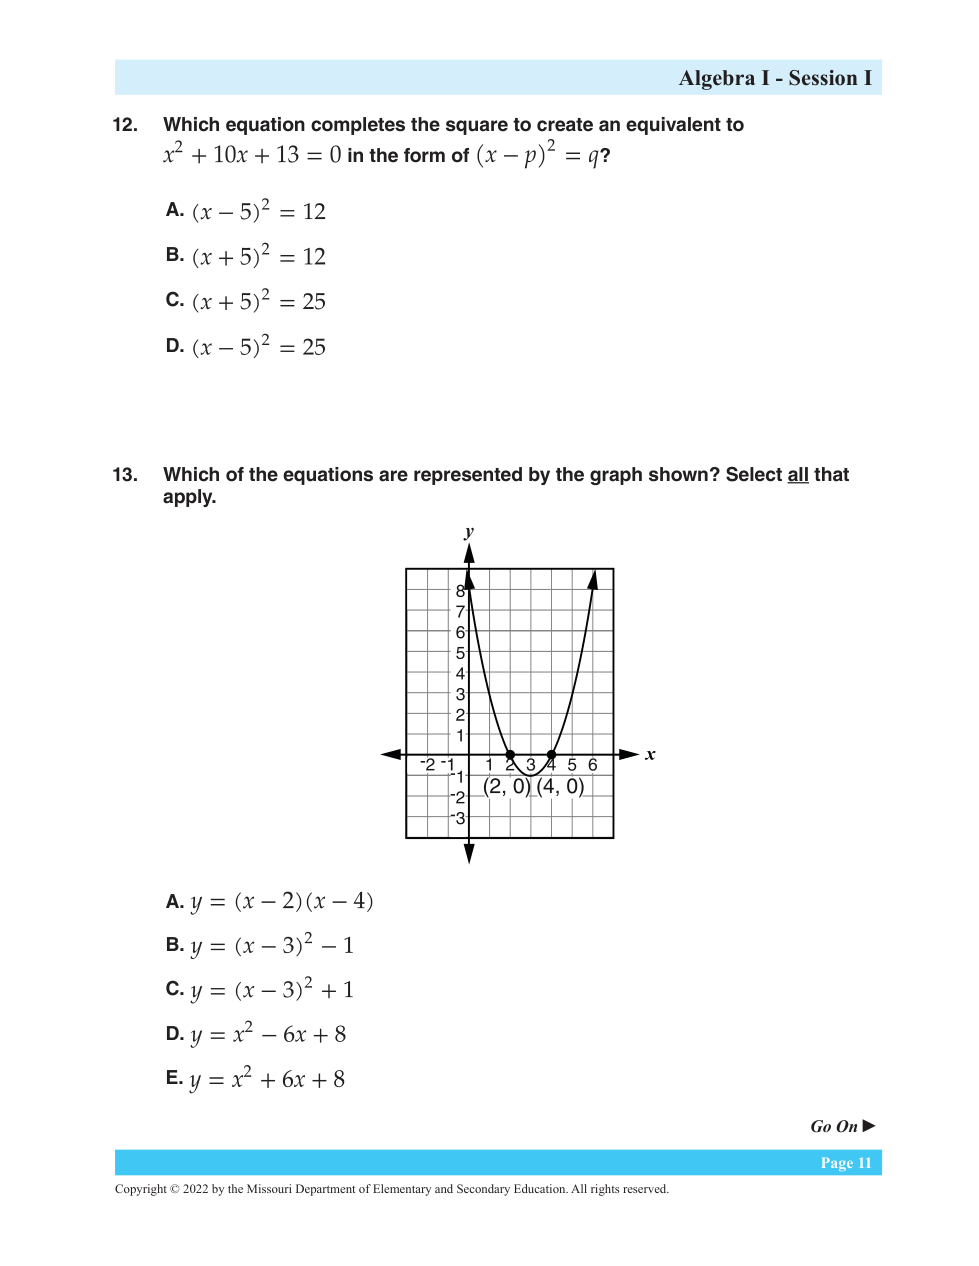
Which of the equations are represented by the graph shown? Select all that apply.
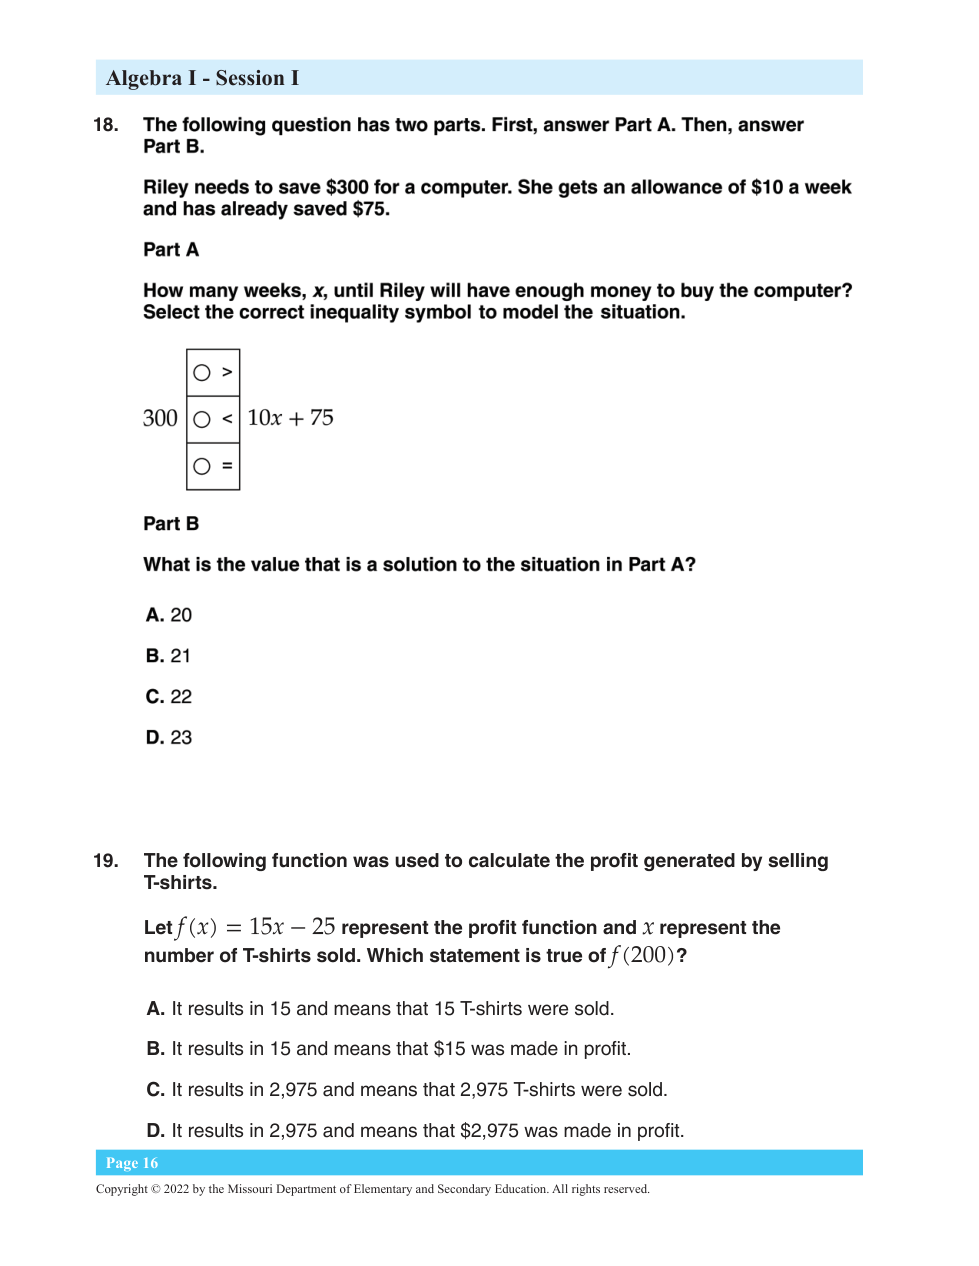
Part A: How many weeks, x, until Riley will have enough money to buy the computer? Select the correct inequality symbol to model the situation
Part B: What is the value that is a solution to the situation in Part A?
Which statement is true of
?
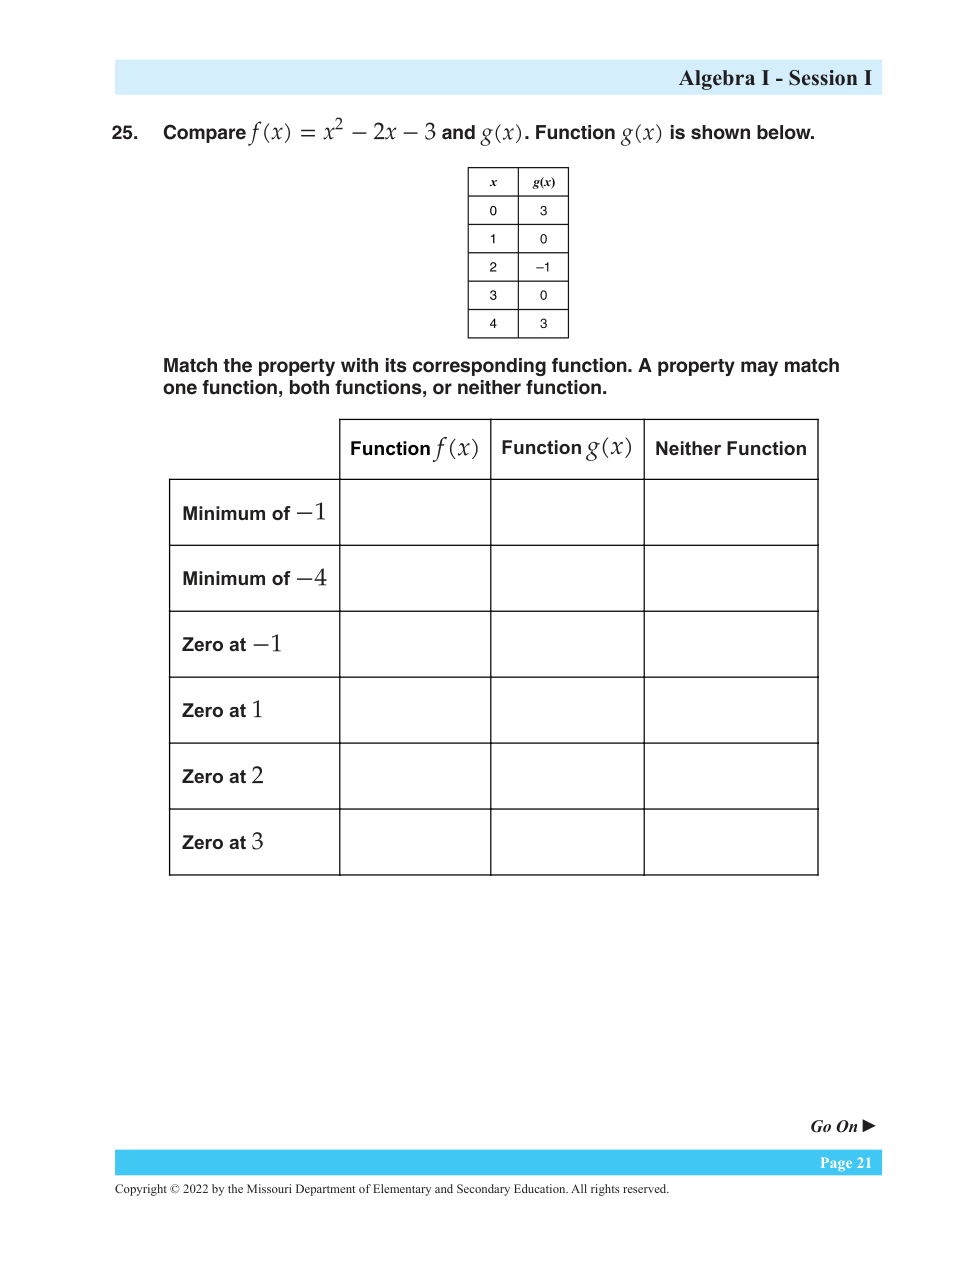
Match the property with its corresponding function. A property may match one function, both functions, or neither function.
Function | Function | Neither Function | |
|---|---|---|---|
Minimum of -1 | |||
Minimum of -4 | |||
Zero at -1 | |||
Zero at 1 | |||
Zero at 2 | |||
Zero at 3 |
Part B: What is the solution to the system? (___ , ___)